U.S. Economic Indicators
Throughout this site there are many discussions of economic indicators. This post is the latest in a series of posts indicating facets of U.S. economic weakness or a notably low growth rate.
The level and trend of economic growth is especially notable at this time. As seen in various measures and near-term projections, the U.S. economy had undergone an outsized level of economic contraction in 2020. However, most people believe (and virtually all prominent economic forecasts indicate) that this historic level of contraction will prove ephemeral in nature; i.e. a sustainable economic rebound will have started in the third quarter of 2020, followed by continual economic expansion.
As seen in the July 2021 Wall Street Journal Economic Forecast Survey the consensus (average estimate) among various economists is for 6.89% GDP growth in 2021, 3.24% GDP growth in 2022, and 2.30% GDP growth in 2023.
Charts Indicating U.S. Economic Weakness
Below are a small sampling of charts that depict weak growth or contraction, and a brief comment for each:
Unemployment Level (UNEMPLOY)
I have written extensively concerning unemployment, as the trends even before early 2020 exhibited (highly) worrisome dynamics.
My analyses indicate that the underlying dynamics of the unemployment situation remain exceedingly worrisome, especially with regard to the future. These dynamics are numerous and complex, and greatly lack recognition and understanding, especially as how from an “all-things-considered” standpoint they will evolve in an economic and societal manner. Further discussion of the long-term U.S. employment situation can be seen on the “U.S. Employment Trends” page.
Of note, the current unemployment situation (since early 2020) is in many ways incomparable to past periods.
Various metrics indicate that current unemployment is very high from a long-term historical perspective.
Shown below is the “Unemployment Level” (UNEMPLOY) statistic, with last value of 9.484 million through June 2021, as of the July 2 update:
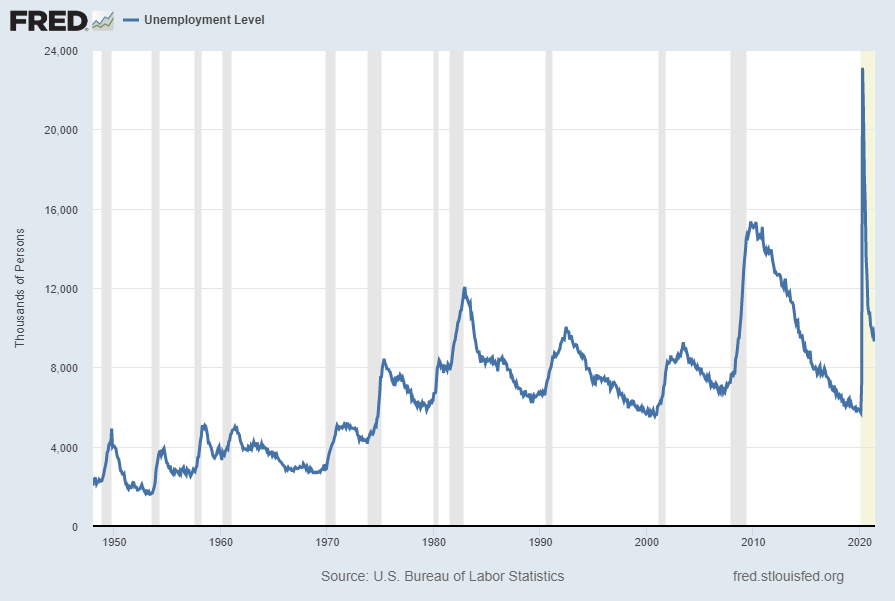
source: U.S. Bureau of Labor Statistics, Unemployment Level [UNEMPLOY], retrieved from FRED, Federal Reserve Bank of St. Louis; accessed July 12, 2021: https://fred.stlouisfed.org/series/UNEMPLOY
__
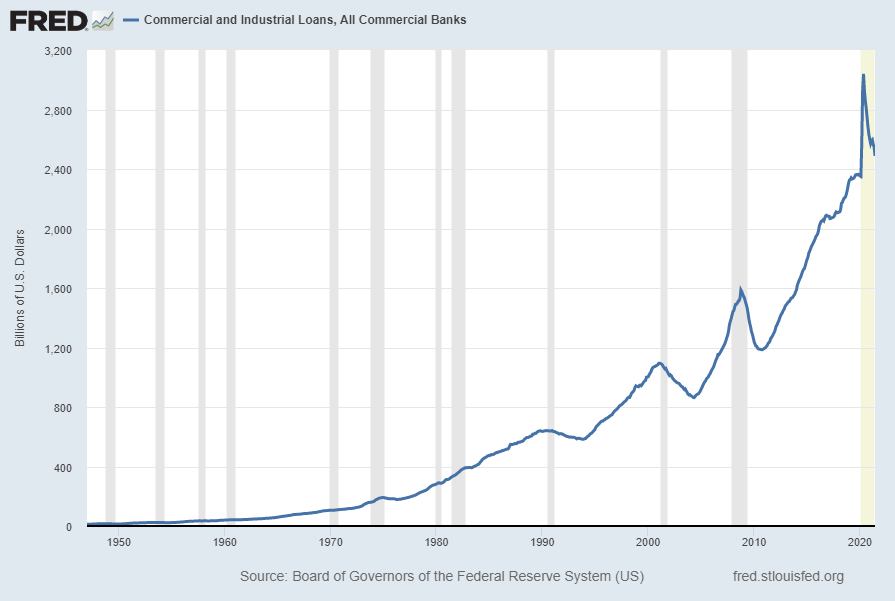
Commercial And Industrial Loans, All Commercial Banks (BUSLOANS)
“Commercial And Industrial Loans, All Commercial Banks” (BUSLOANS) has recently been declining. Shown below is this measure with last value of $2,487.8922 Billion through June, last updated July 9, 2021:
Below is this measure displayed on a “Percent Change From Year Ago” basis with value -15.0%:
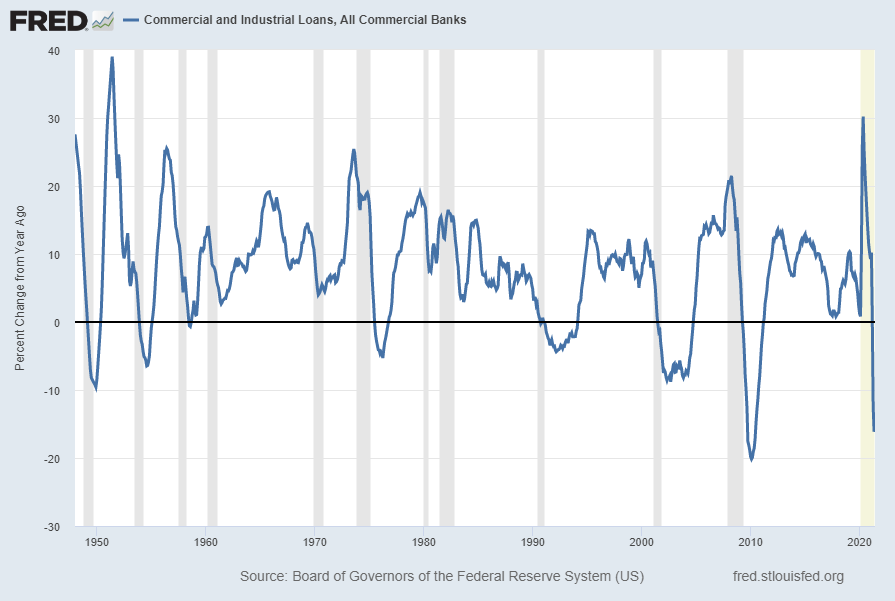
source: Board of Governors of the Federal Reserve System (US), Commercial and Industrial Loans, All Commercial Banks [BUSLOANS], retrieved from FRED, Federal Reserve Bank of St. Louis; accessed July 12, 2021: https://fred.stlouisfed.org/series/BUSLOANS
__
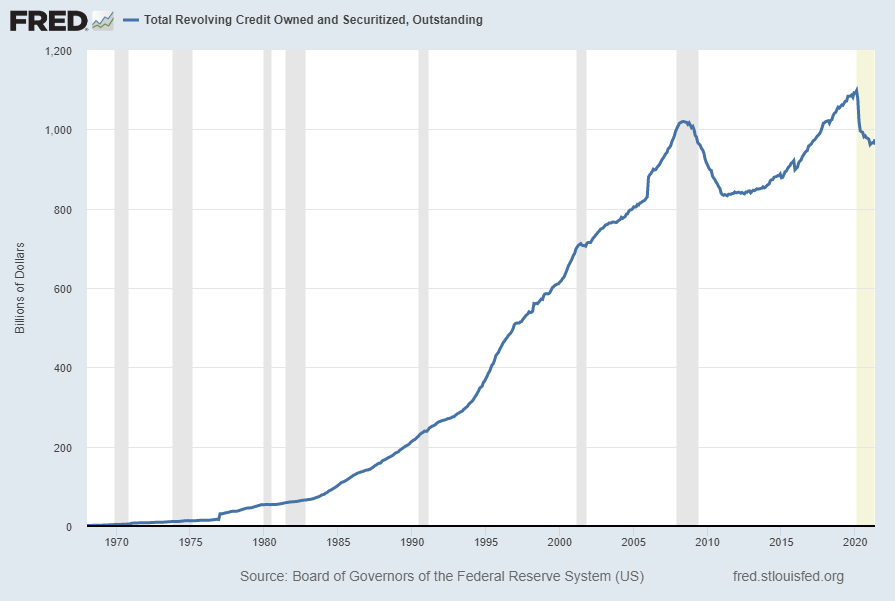
Total Revolving Credit Owned And Securitized, Outstanding (REVOLSL)
“Total Revolving Credit Owned And Securitized, Outstanding” (REVOLSL) has recently been declining. Shown below is this measure with last value of $974.60459 Billion through May, last updated July 8, 2021:
Below is this measure displayed on a “Percent Change From Year Ago” basis with value -2.2%:
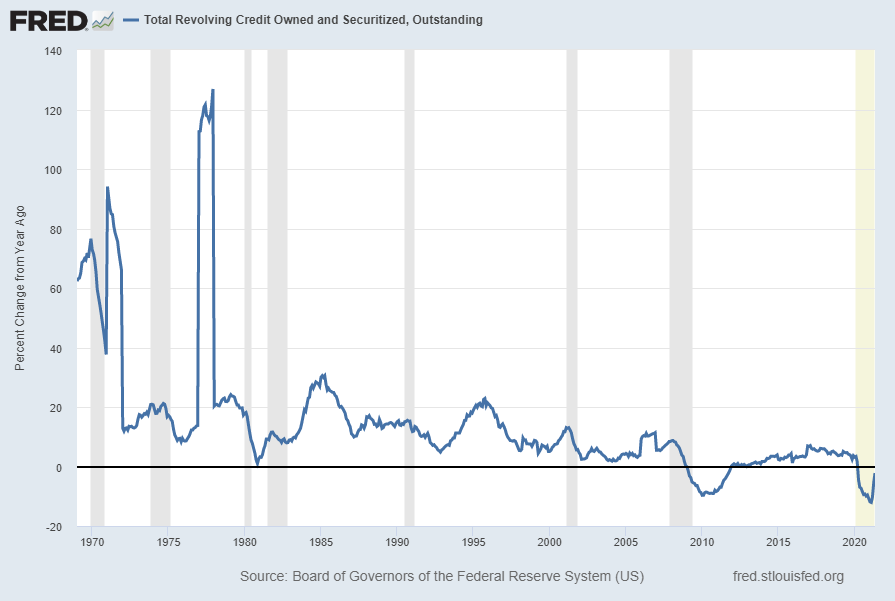
source: Board of Governors of the Federal Reserve System (US), Total Revolving Credit Owned and Securitized, Outstanding [REVOLSL], retrieved from FRED, Federal Reserve Bank of St. Louis; accessed July 12, 2021: https://fred.stlouisfed.org/series/REVOLSL
__
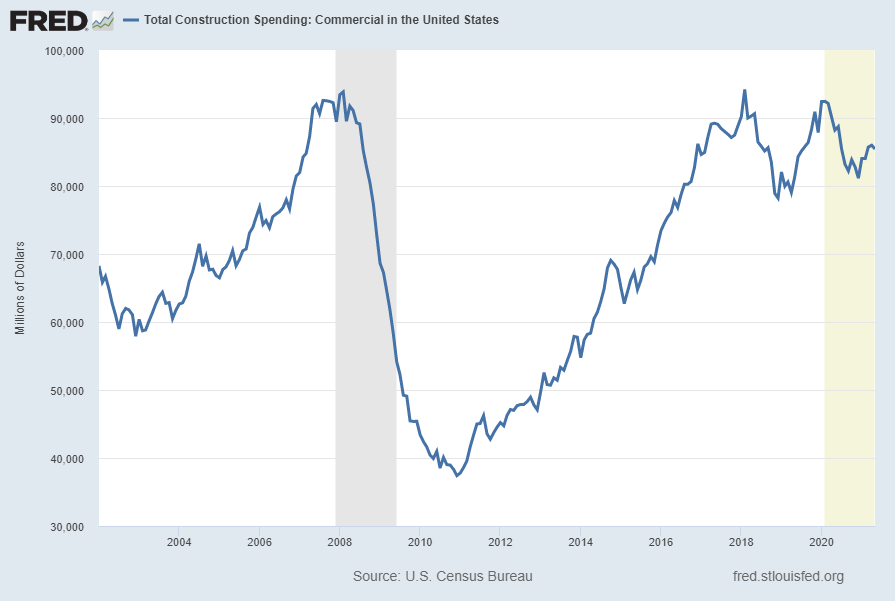
Total Construction Spending: Commercial (TLCOMCONS)
“Total Construction Spending: Commercial” is a measure of construction exhibiting a contraction on a “Percent Change From Year Ago” basis. Shown below is this measure with last value of $85,440 Million through May 2021, last updated July 1, 2021:
Shown below is the measure displayed on a “Percent Change From Year Ago” basis with a value of -3.1%:
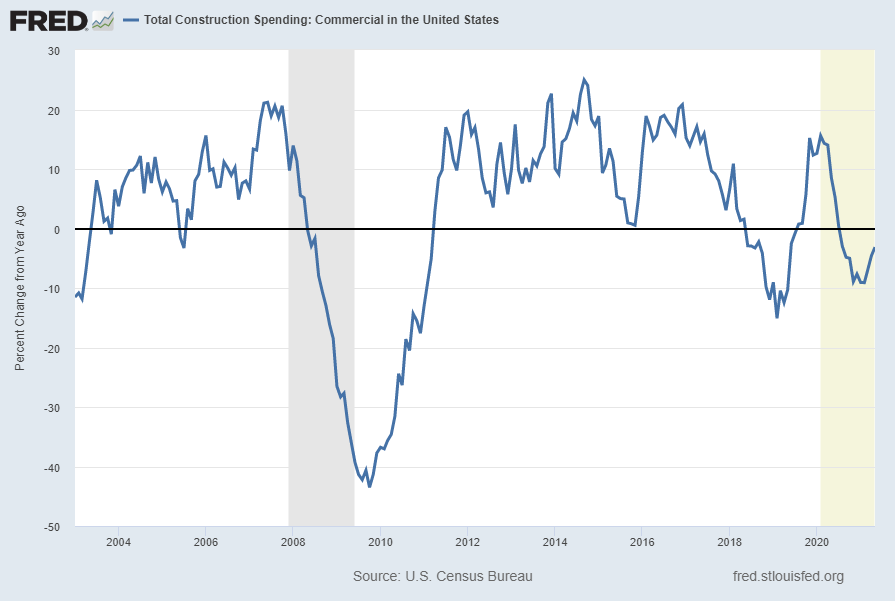
source: U.S. Bureau of the Census, Total Construction Spending: Commercial [TLCOMCONS], retrieved from FRED, Federal Reserve Bank of St. Louis, accessed July 11, 2021: https://fred.stlouisfed.org/series/TLCOMCONS
__
Other Indicators
As mentioned previously, many other indicators discussed on this site indicate slow economic growth or economic contraction, if not outright (gravely) problematical economic conditions.
_____
The Special Note summarizes my overall thoughts about our economic situation
SPX at 4374.30 as this post is written