I have written many blog posts concerning the worrisome trends in income and earnings.
Along these lines, one of the measures showing disconcerting trends is that of hourly earnings.
While the concept of hourly earnings can be defined and measured in a variety of ways, below are a few charts that I believe broadly illustrate problematic trends.
The first chart depicts Average Hourly Earnings Of All Employees: Total Private (FRED series CES0500000003)(current value = $30.17):
(click on chart to enlarge image)(chart last updated 5-7-21)
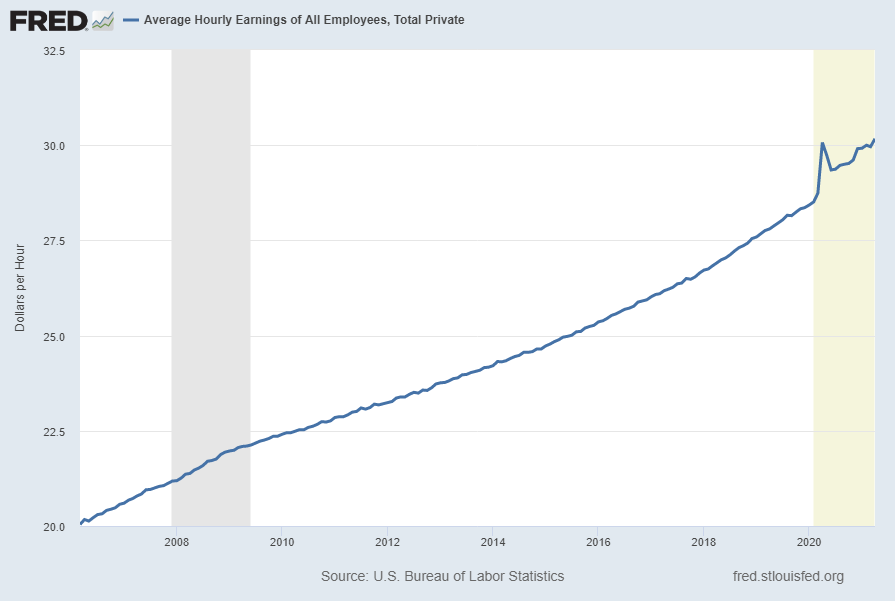
Data Source: FRED, Federal Reserve Economic Data, Federal Reserve Bank of St. Louis: Average Hourly Earnings of All Employees: Total Private [CES0500000003] ; U.S. Department of Labor: Bureau of Labor Statistics; accessed May 7, 2021:
http://research.stlouisfed.org/fred2/series/CES0500000003
–
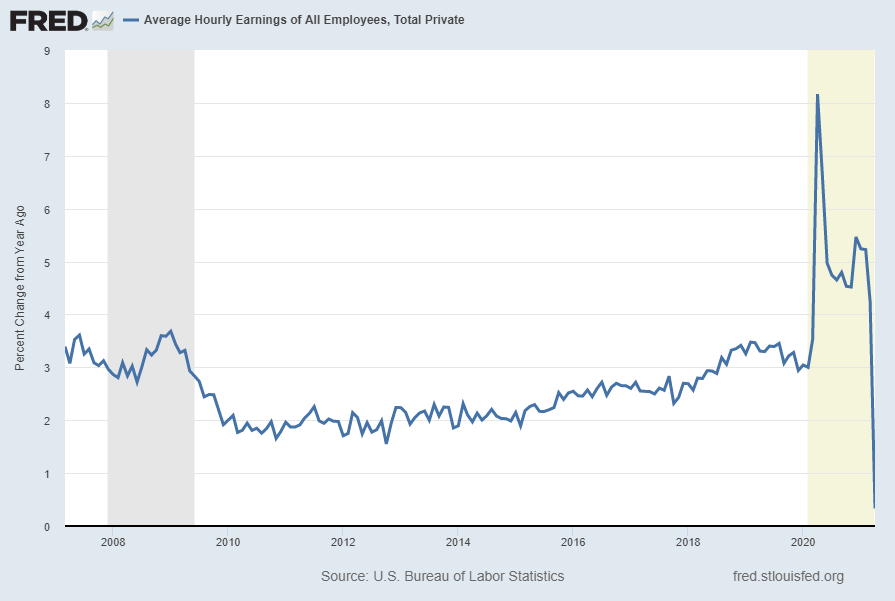
This next chart depicts this same measure on a “Percentage Change From A Year Ago” basis. While not totally surprising, I find the decline from 2009 and subsequent trend to be disconcerting:
(click on chart to enlarge image)(chart last updated 5-7-21)
–
There are slightly different measures available from a longer-term perspective. Pictured below is another measure, the Average Hourly Earnings of Production and Nonsupervisory Employees – Total Private (FRED series AHETPI)(current value = $25.45):
(click on chart to enlarge image)(chart last updated 5-7-21)
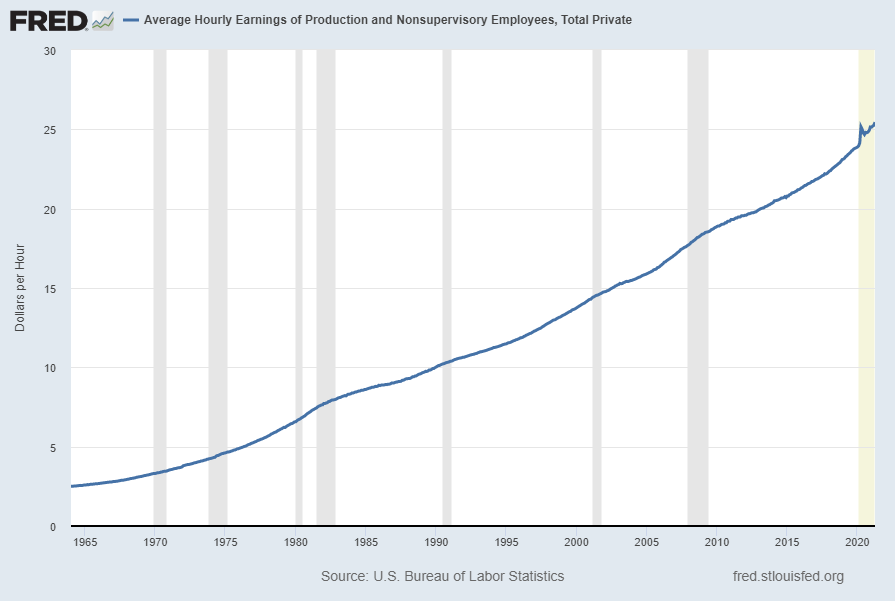
Data Source: FRED, Federal Reserve Economic Data, Federal Reserve Bank of St. Louis: Average Hourly Earnings of Production and Nonsupervisory Employees: Total Private [AHETPI] ; U.S. Department of Labor: Bureau of Labor Statistics; accessed May 7, 2021:
http://research.stlouisfed.org/fred2/series/AHETPI
–
Pictured below is this AHETPI measure on a “Percentage Change From A Year Ago” basis. While not totally surprising, I find the decline from 2009 and subsequent trend to be disconcerting:
(click on chart to enlarge image)(chart last updated 5-7-21)
![Average Hourly Earnings of Production and Nonsupervisory Employees: Total Private [AHETPI] Percent Change From Year Ago](https://www.economicgreenfield.com/wp-content/uploads/2021/05/AHETPI_5-7-21-25.45-1.2-Percent-Change-From-Year-Ago.png)
–
I will continue to actively monitor these trends, especially given the post-2009 dynamics.
_________
I post various economic indicators and indices because I believe they should be carefully monitored. However, as those familiar with this site are aware, I do not necessarily agree with what they depict or imply.
_____
The Special Note summarizes my overall thoughts about our economic situation
SPX at 4232.97 this post is written