I have written extensively about the importance of U.S. interest rate levels. Rising interest rates have substantial ramifications for many aspects of the current-day economy. My commentaries with regard to interest rates and the bond bubble are largely found under the “bond bubble” tag. From an intervention perspective commentary is found under the “Intervention” category.
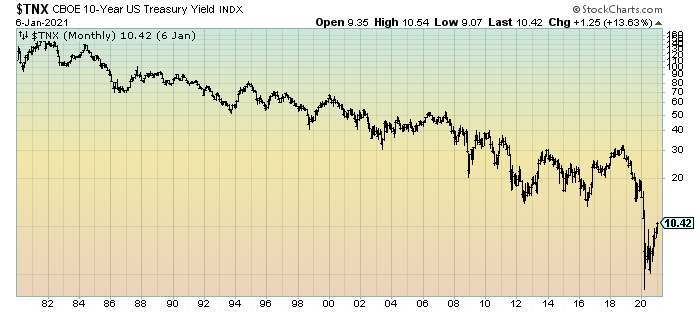
As reference, below is a long-term chart of the 10-Year Treasury yield since 1980, depicted on a monthly basis, LOG scale:
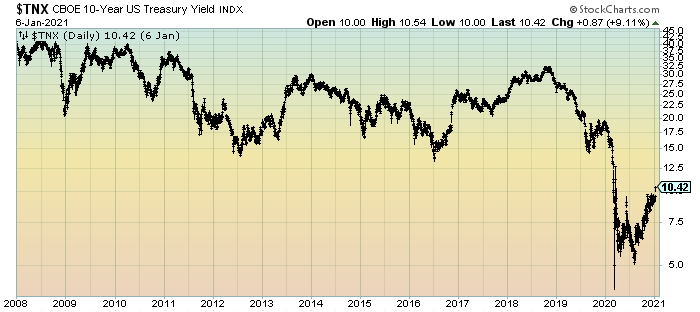
(click on charts to enlarge images)(charts courtesy of StockCharts.com; chart creation and annotation by the author)
Here is a long-term chart of the 10-Year Treasury yield since 2008, depicted on a daily basis, LOG scale:
_____
The Special Note summarizes my overall thoughts about our economic situation
SPX at 3804.48 as this post is written