U.S. Economic Indicators
Throughout this site there are many discussions of economic indicators. This post is the latest in a series of posts indicating U.S. economic weakness or a notably low growth rate.
The level and trend of economic growth is especially notable at this time. As seen in various measures and near-term projections, the U.S. economy has undergone an outsized level of economic contraction. However, most people believe (and virtually all prominent economic forecasts indicate) that this historic level of contraction will be temporary in nature and that a sustainable economic rebound will have started in the third quarter of 2020.
As seen in the December 2020 Wall Street Journal Economic Forecast Survey the consensus (average estimate) among various economists is for -2.74% GDP growth in 2020, 3.69% GDP growth in 2021, and 2.93% GDP growth in 2022.
Charts Indicating U.S. Economic Weakness
Below are a small sampling of charts that depict weak growth or contraction, and a brief comment for each:
The Weekly Economic Index (WEI)
A recently-introduced indicator, the Weekly Economic Index, is an economic indicator that is a composite of 10 different weekly indicators. It is (purportedly) designed to provide a timely depiction of the U.S. economic trend. As seen below, it depicts the severity of the recent plunge in economic activity and subsequent rebound.
The Weekly Economic Index (WEI) with a value of -2.39, updated as of December 10, 2020 (incorporating data through December 5, 2020):
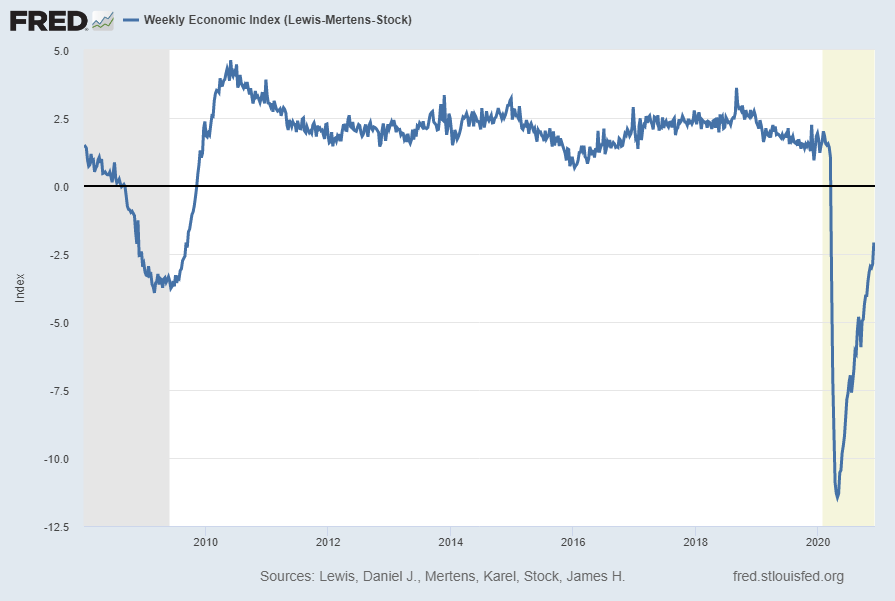
source: Lewis, Daniel J., Mertens, Karel and Stock, James H., Weekly Economic Index (Lewis-Mertens-Stock) [WEI], retrieved from FRED, Federal Reserve Bank of St. Louis; accessed December 11, 2020: https://fred.stlouisfed.org/series/WEI
__
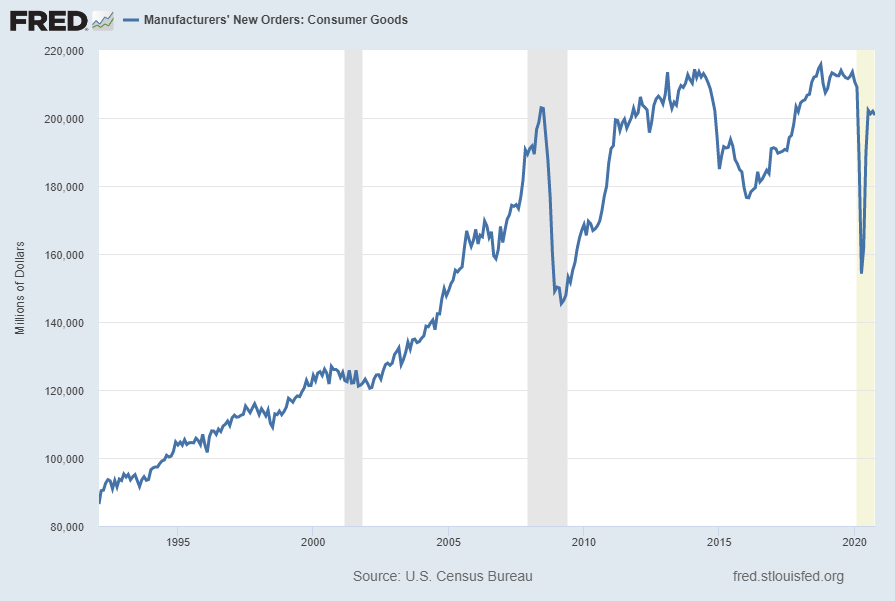
Value of Manufacturers’ New Orders for Consumer Goods Industries (ACOGNO)
A measure for consumer goods exhibiting a recent outsized weakening followed by a partial rebound is the “Value of Manufacturers’ New Orders for Consumer Goods Industries” (ACOGNO). Shown below is this measure with last value of $200,838 Million through October 2020 (last updated December 4, 2020):
Displayed below is this same ACOGNO measure on a “Percent Change From Year Ago” basis with value -5.1%, last updated December 4, 2020:
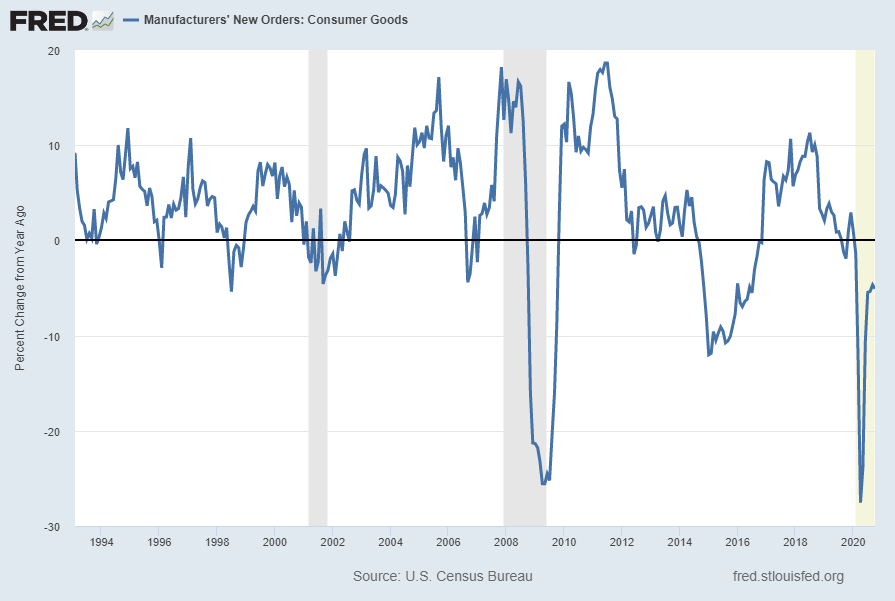
source: U.S. Census Bureau, Value of Manufacturers’ New Orders for Consumer Goods Industries [ACOGNO], retrieved from FRED, Federal Reserve Bank of St. Louis; accessed December 12, 2020: https://fred.stlouisfed.org/series/ACOGNO
__
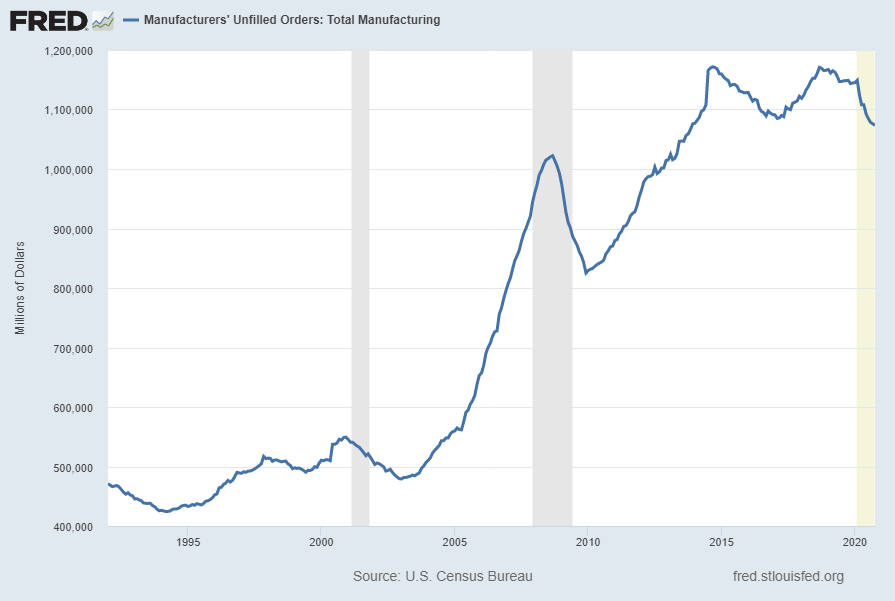
Manufacturers’ Unfilled Orders: Total Manufacturing (AMTMUO)
A measure for manufacturing showing a continuing decline is “Manufacturers’ Unfilled Orders: Total Manufacturing” (AMTMUO). Shown below is this measure with last value of $1,073,292 Million through October 2020 (last updated December 4, 2020):
Displayed below is this same AMTMUO measure on a “Percent Change From Year Ago” basis with value -6.6%, last updated December 4, 2020:
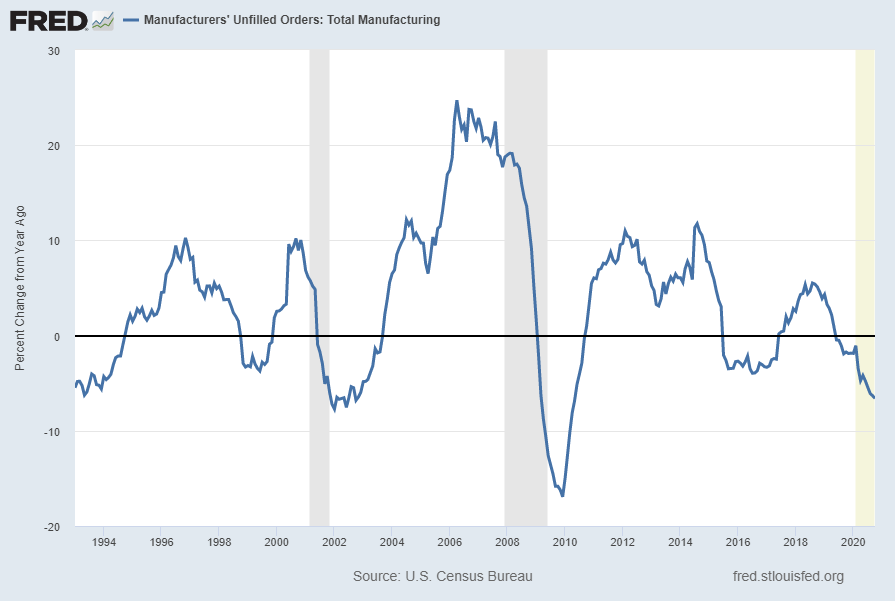
source: U.S. Census Bureau, Manufacturers’ Unfilled Orders: Total Manufacturing [AMTMUO], retrieved from FRED, Federal Reserve Bank of St. Louis; accessed December 12, 2020: https://fred.stlouisfed.org/series/AMTMUO
__
Rail Freight Carloads (RAILFRTCARLOADSD11)
“Rail Freight Carloads” continues to show a generally downward progression from a longer-term perspective. Shown below is a chart with data through September 2020 (last value of 955,344), updated November 16, 2020:
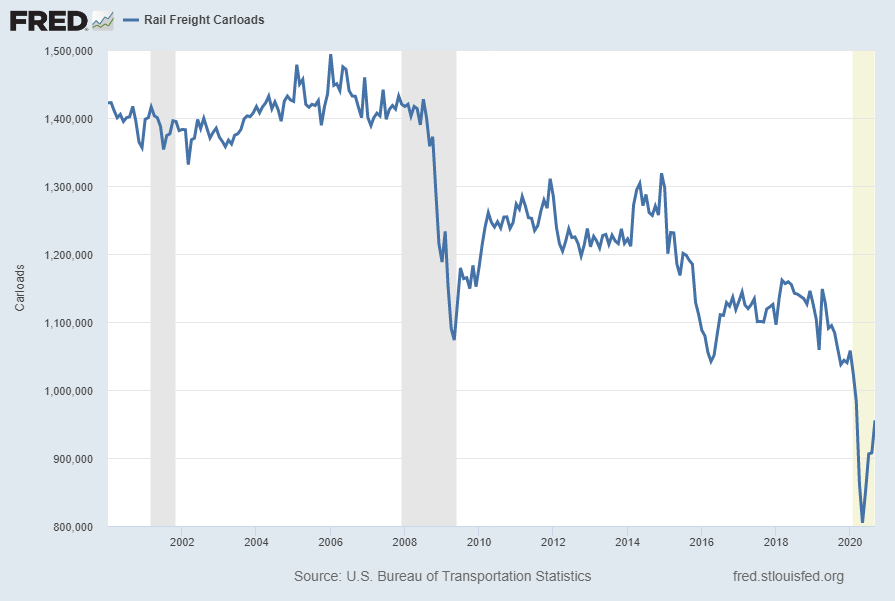
Here is the same measure on a “Percent Change From Year Ago” basis, with value -9.9%:

source: U.S. Bureau of Transportation Statistics, Rail Freight Carloads [RAILFRTCARLOADSD11], retrieved from FRED, Federal Reserve Bank of St. Louis; accessed December 12, 2020: https://fred.stlouisfed.org/series/RAILFRTCARLOADSD11
__
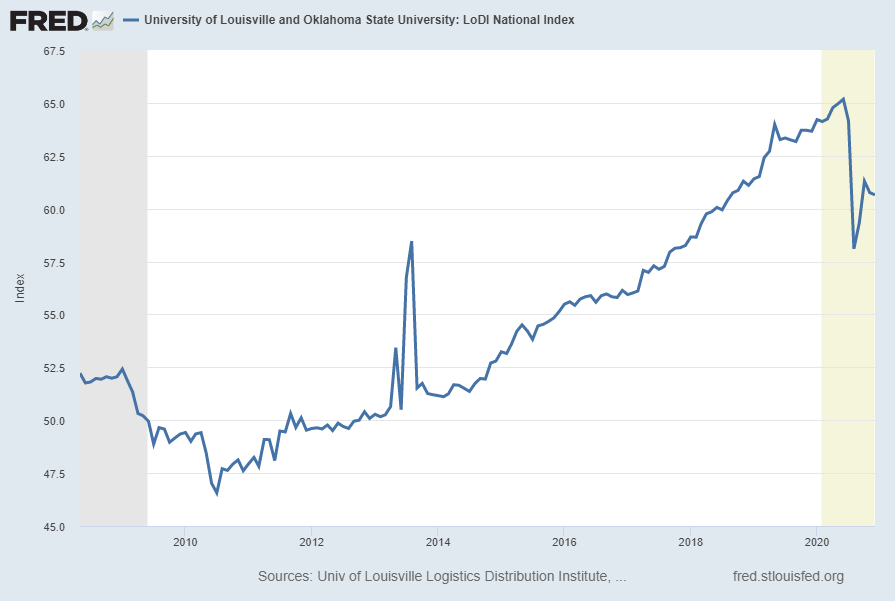
University of Louisville and Oklahoma State University: LoDI National Index (LODINIM066N)
The LoDI National Index is described in FRED as:
The LoDI Index uses linear regression analysis to combine cargo volume data from rail, barge, air, and truck transit, along with various economic factors. The resulting indicator is designed to predict upcoming changes in the level of logistics and distribution activity in the US and is represented by a value between 1 and 100. An index at or above 50 represents a healthy level of activity in the industry.
As seen in the long-term chart below, the index appears to be faltering in its rebound from the recent 2020 decline.
Shown below is a chart with data through December 2020 (last value of 60.65566), updated December 1, 2020:
Below is this measure displayed on a “Percent Change From Year Ago” basis with value -4.7%:
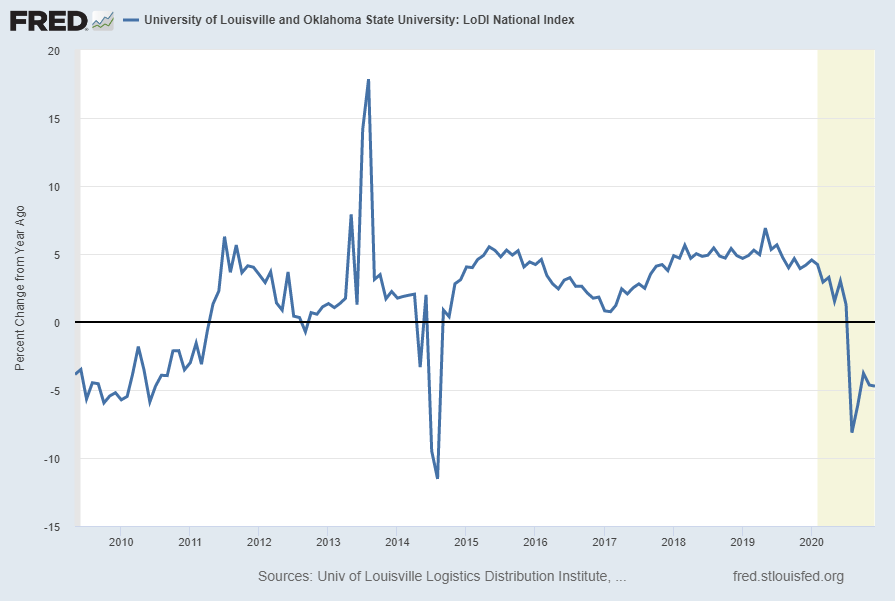
source: University of Louisville. Logistics and Distribution Institute and Oklahoma State University, University of Louisville and Oklahoma State University: LoDI National Index [LODINIM066N], retrieved from FRED, Federal Reserve Bank of St. Louis; accessed December 12, 2020: https://fred.stlouisfed.org/series/LODINIM066N
__
Other Indicators
As mentioned previously, many other indicators discussed on this site indicate slow economic growth or economic contraction, if not outright (gravely) problematical economic conditions.
_____
The Special Note summarizes my overall thoughts about our economic situation
SPX at 3663.46 as this post is written