U.S. Economic Indicators
Throughout this site there are many discussions of economic indicators. This post is the latest in a series of posts indicating U.S. economic weakness or a notably low growth rate.
The level and trend of economic growth is especially notable at this time. As seen in various measures and near-term projections, the U.S. economy is undergoing an outsized level of economic contraction. However, most people believe that this historic level of contraction will be temporary in nature and that an economic rebound will start in the third quarter of 2020.
As seen in the September 2020 Wall Street Journal Economic Forecast Survey the consensus (average estimate) among various economists is for -4.19% GDP growth in 2020, 4.00% GDP growth in 2021, and 3.13% GDP growth in 2022.
Charts Indicating U.S. Economic Weakness
Below are a small sampling of charts that depict weak growth or contraction, and a brief comment for each:
The Weekly Economic Index (WEI)
A recently-introduced indicator, the Weekly Economic Index, is an economic indicator that is a composite of 10 different weekly indicators. It is (purportedly) designed to provide a timely depiction of the U.S. economic trend. As seen below, it depicts the severity of the recent plunge in economic activity.
The Weekly Economic Index (WEI) with a value of -4.26, updated as of September 10, 2020 (incorporating data through September 5, 2020):
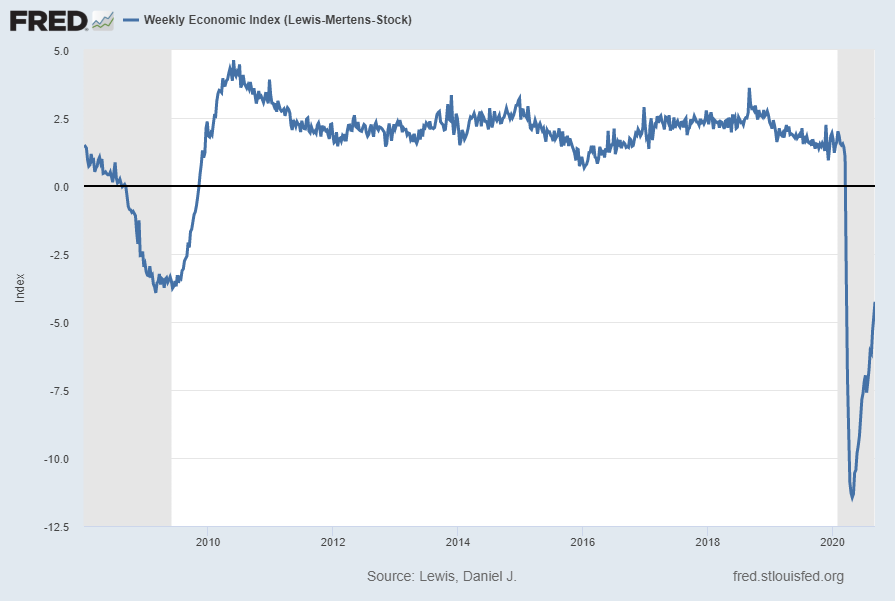
source: Lewis, Daniel J., Mertens, Karel and Stock, James H., Weekly Economic Index (Lewis-Mertens-Stock) [WEI], retrieved from FRED, Federal Reserve Bank of St. Louis, accessed September 10, 2020; https://fred.stlouisfed.org/series/WEI
__
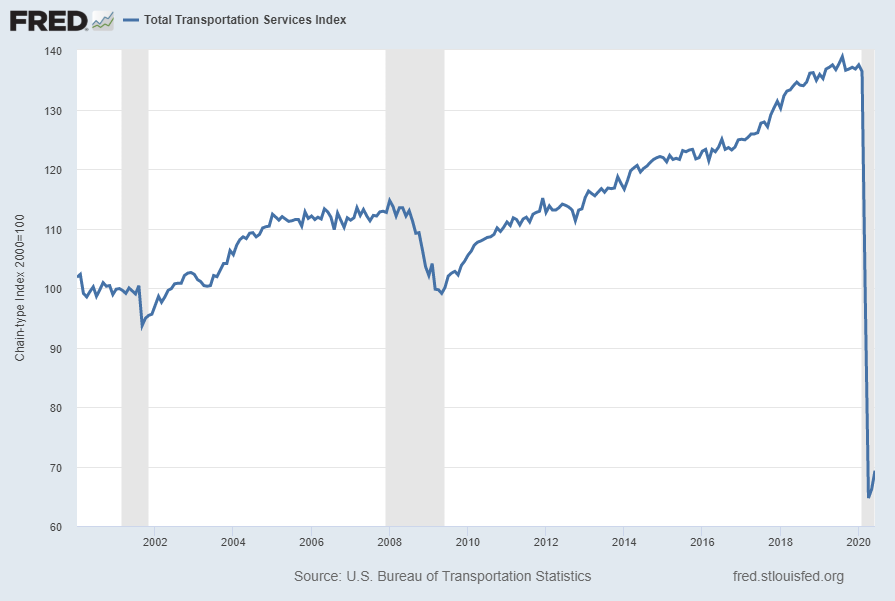
Total Transportation Services Index (TSITTL)
“Total Transportation Services Index” (TSITTL), like other transportation measures, is exhibiting recent substantial weakness. Shown below is this measure with last value of 69.3 through June, last updated September 11, 2020:
Below is this measure displayed on a “Percent Change From Year Ago” basis with value -49.3%:
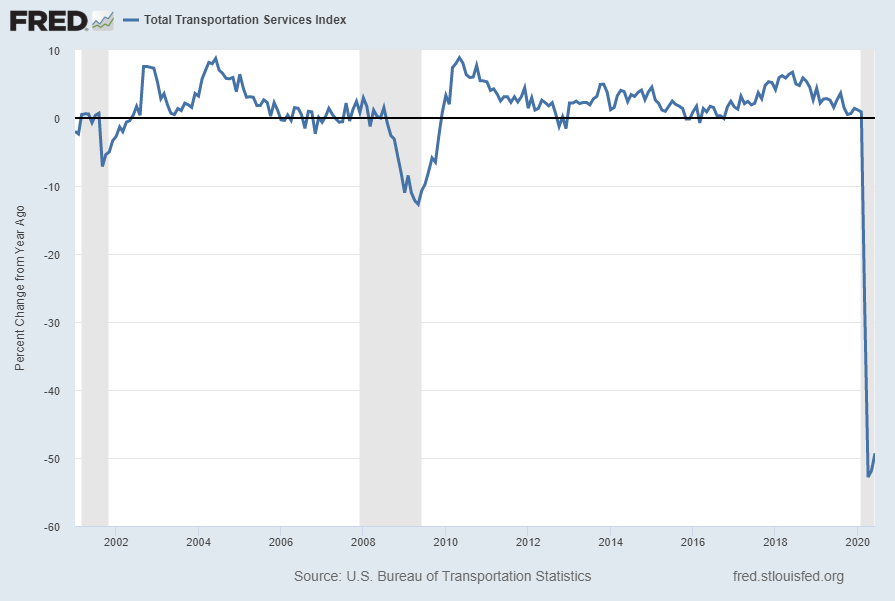
source: U.S. Bureau of Transportation Statistics, Total Transportation Services Index [TSITTL], retrieved from FRED, Federal Reserve Bank of St. Louis; accessed September 13, 2020; https://fred.stlouisfed.org/series/TSITTL
__
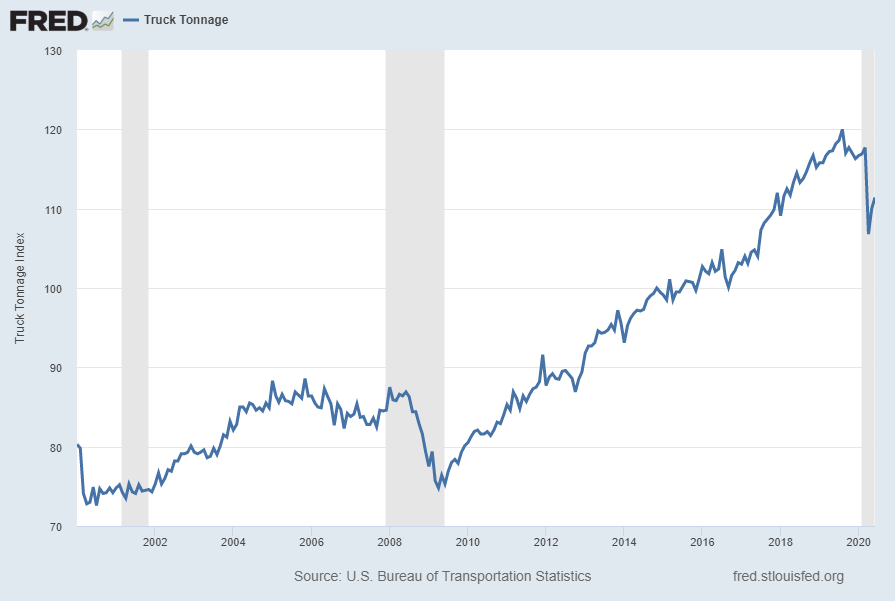
Truck Tonnage (TRUCKD11)
“Truck Tonnage” (TRUCKD11), like other transportation measures, is exhibiting recent weakness. Shown below is this measure with last value of 111.4 through June, last updated August 18, 2020:
Below is this measure displayed on a “Percent Change From Year Ago” basis with value -5.8%:
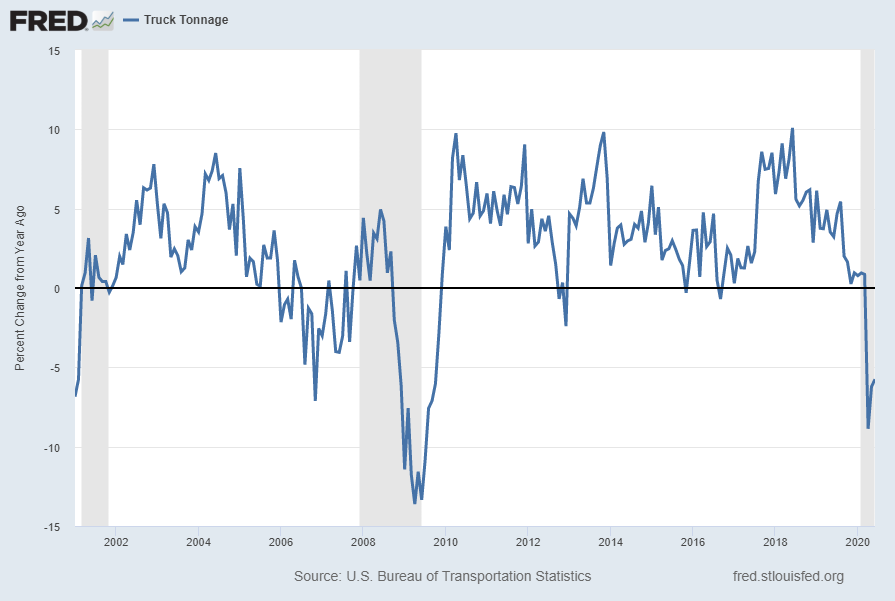
source: U.S. Bureau of Transportation Statistics, Truck Tonnage [TRUCKD11], retrieved from FRED, Federal Reserve Bank of St. Louis; accessed September 10, 2020: https://fred.stlouisfed.org/series/TRUCKD11
__
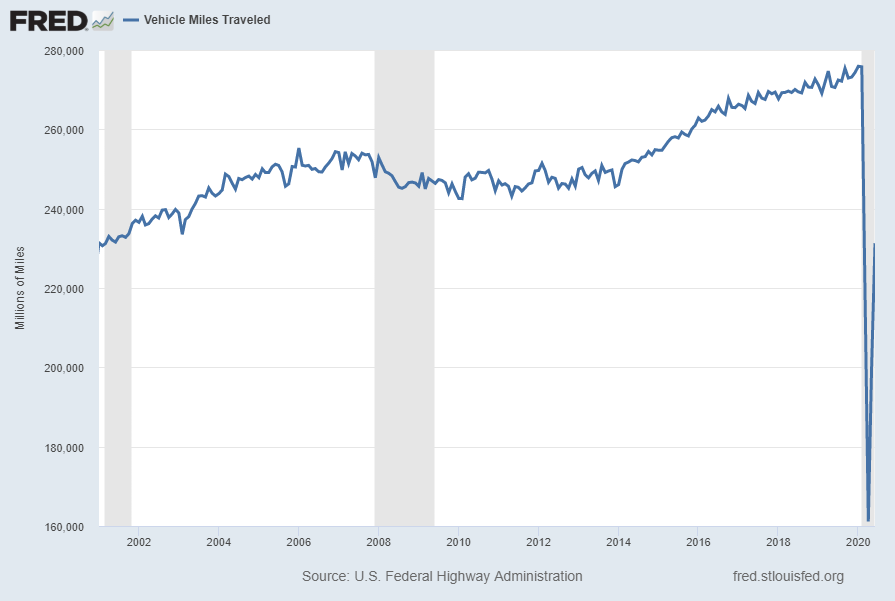
Vehicle Miles Traveled (TRFVOLUSM227SFWA)
Another indication of transportation and mobility is the Vehicle Miles Traveled indicator.
Shown below is this measure with last value of 231,305 (Millions of Miles) through June, last updated August 21, 2020:
Below is this measure displayed on a “Percent Change From Year Ago” basis with value -14.5%:
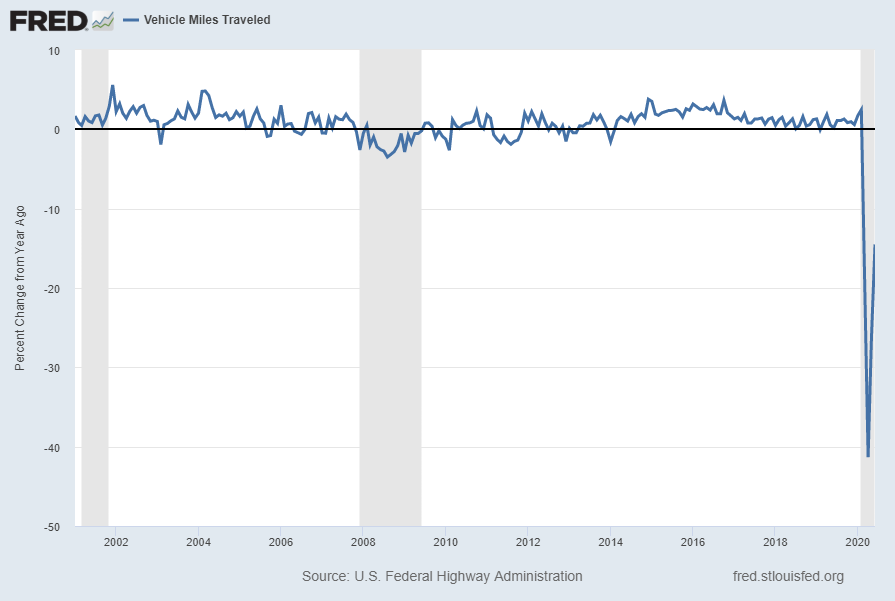
source: U.S. Federal Highway Administration, Vehicle Miles Traveled [TRFVOLUSM227SFWA], retrieved from FRED, Federal Reserve Bank of St. Louis; accessed September 10, 2020: https://fred.stlouisfed.org/series/TRFVOLUSM227SFWA
__
Unemployment
I have written extensively concerning unemployment, as the current and future unemployment issue is of tremendous importance.
Of note, the current unemployment situation, as depicted by various statistics, is in many ways incomparable to past periods given various dynamics of the current (since early 2020) situation and how these dynamics are being reflected and otherwise portrayed.
However, even given these issues, various metrics indicate that current unemployment is very high from a long-term historical perspective.
My analyses indicate that the underlying dynamics of the unemployment situation remain exceedingly worrisome, especially with regard to the future. These dynamics are numerous and complex, and greatly lack recognition and understanding, especially as how from an “all-things-considered” standpoint they will evolve in an economic and societal manner. Further discussion of the long-term U.S. employment situation can be seen on the “U.S. Employment Trends” page.
While there are many charts that can be shown, one that depicts a worrisome trend is the Employment-Population Ratio for those ages 25 – 54 years. [The Employment-Population Ratio is the Civilian Employed divided by the Civilian Noninstitutional Population]. Among disconcerting aspects of this measure is the recent plunge as well as the long-term (most notably the post-2000) trend, especially given this demographic segment.
The current value as of the September 4, 2020 update (reflecting data through the August employment report) is 75.3%:
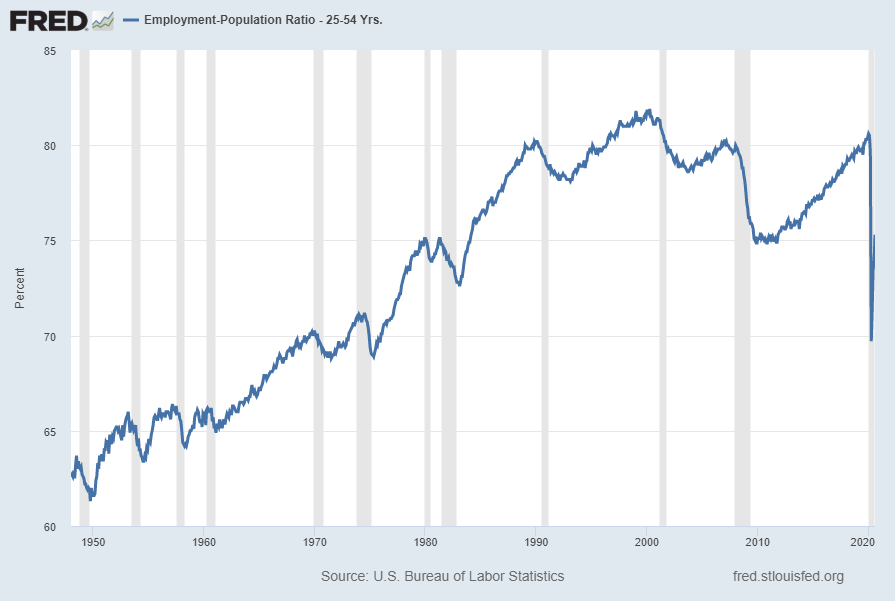
Data Source: U.S. Bureau of Labor Statistics, Employment Population Ratio: 25 – 54 years [LNS12300060], retrieved from FRED, Federal Reserve Bank of St. Louis, accessed July 11, 2020: https://fred.stlouisfed.org/series/LNS12300060
__
Other Indicators
As mentioned previously, many other indicators discussed on this site indicate economic weakness or economic contraction, if not outright (gravely) problematical economic conditions.
_____
The Special Note summarizes my overall thoughts about our economic situation
SPX at 3340.97 as this post is written