U.S. Economic Indicators
Throughout this site there are many discussions of economic indicators. This post is the latest in a series of posts indicating U.S. economic weakness or a notably low growth rate.
The level and trend of economic growth is especially notable at this time. As seen in various measures and near-term projections, the U.S. economy is undergoing an outsized level of economic contraction. As seen in many surveys and projections, most people believe that this historic level of contraction will be temporary in nature and that an economic rebound will start in the third quarter of 2020.
As seen in the May 2020 Wall Street Journal Economic Forecast Survey the consensus (average estimate) among various economists is for -6.64% GDP growth in 2020 and 5.0% GDP growth in 2021.
Charts Indicating U.S. Economic Weakness
Below are a small sampling of charts that depict weak growth or contraction, and a brief comment for each:
The Chicago Fed National Activity Index (CFNAI)
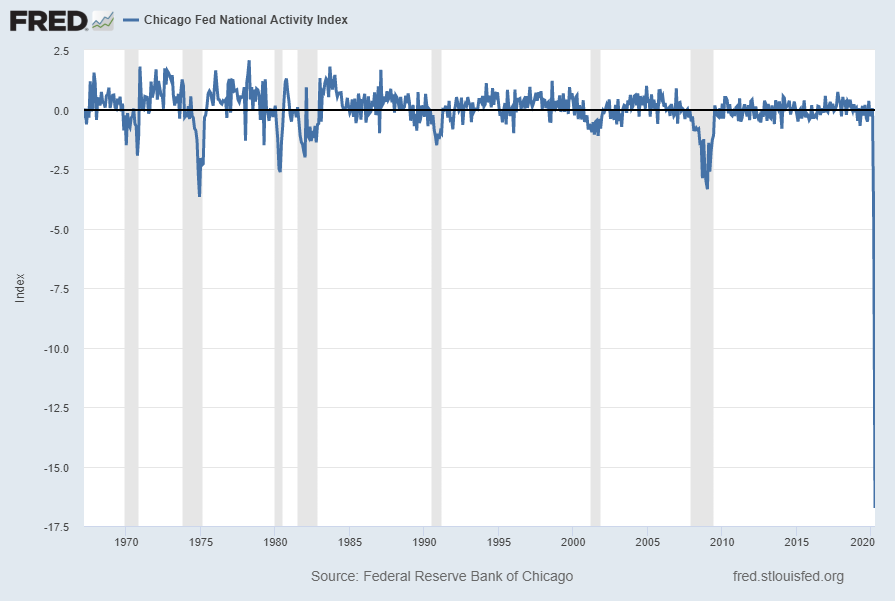
A broad-based economic indicator that has been implying substantial contraction is the Chicago Fed National Activity Index (CFNAI).
The May 2020 Chicago Fed National Activity Index (CFNAI) updated as of May 26, 2020:
The CFNAI, with current reading of -16.74:
The CFNAI-MA3, with current reading of -7.22:
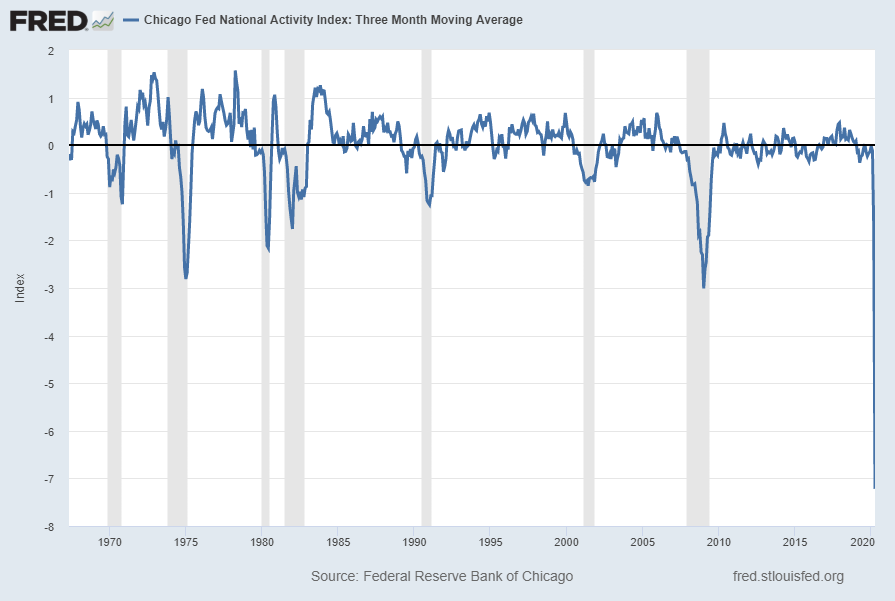
source: Federal Reserve Bank of Chicago, Chicago Fed National Activity Index [CFNAI], retrieved from FRED, Federal Reserve Bank of St. Louis, May 26, 2020;
https://fred.stlouisfed.org/series/CFNAI
__
The Weekly Economic Index (WEI)
A recently-introduced indicator, the Weekly Economic Index, is an economic indicator that is a composite of 10 different weekly indicators. It is (purportedly) designed to provide a timely depiction of the U.S. economic trend. As seen below, it depicts the severity of the recent plunge in economic activity.
The Weekly Economic Index (WEI) with a value of -11.00, updated as of June 9, 2020 (incorporating data through June 6):
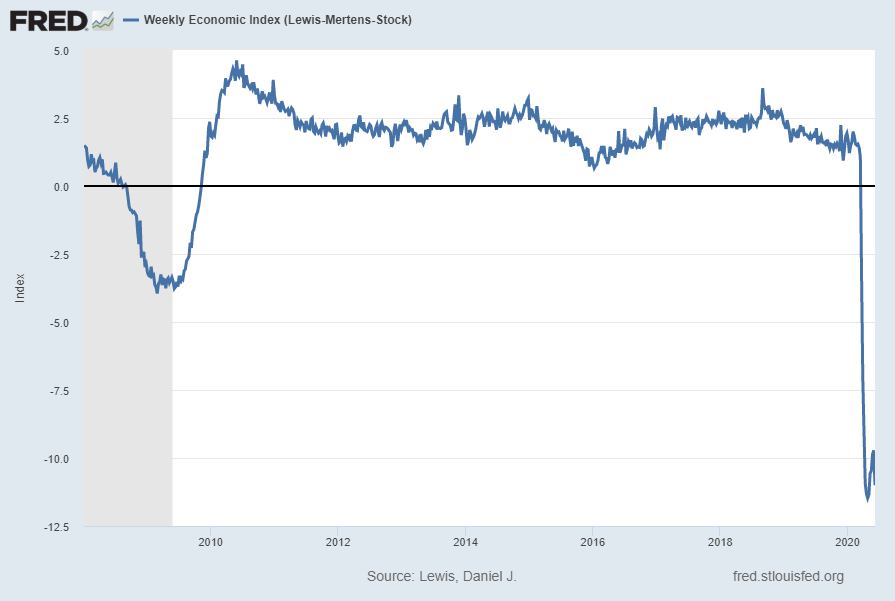
source: Lewis, Daniel J., Mertens, Karel and Stock, James H., Weekly Economic Index (Lewis-Mertens-Stock) [WEI], retrieved from FRED, Federal Reserve Bank of St. Louis, June 11, 2020; https://fred.stlouisfed.org/series/WEI
__
Advance Retail Sales: Retail and Food Services, Total (RSAFS)
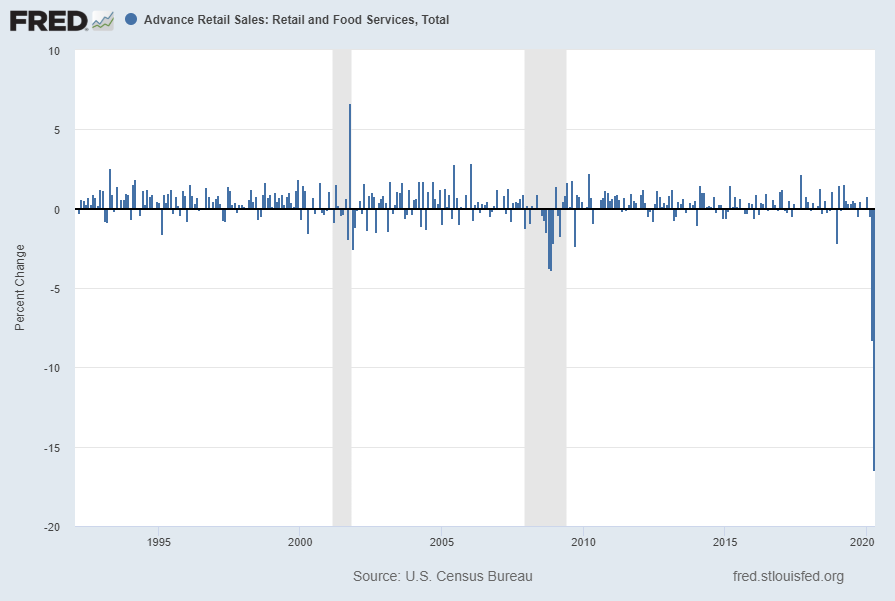
The “Advance Retail Sales: Retail and Food Services, Total (RSAFS)” measure is currently exhibiting notable trends. Shown below is this measure displayed from 1992, with last value of $403,946 Million through April 2020, last updated May 15, 2020:
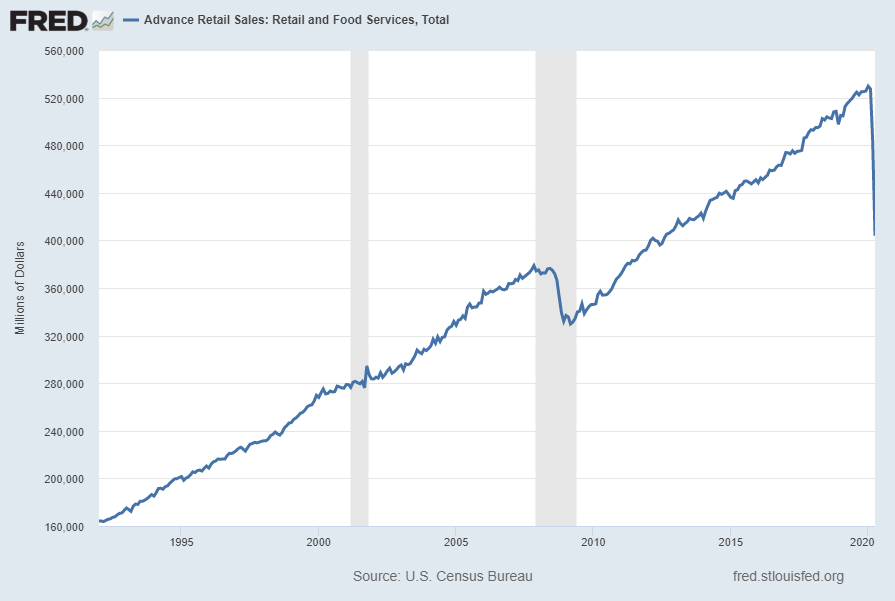
Displayed below is this same RSAFS measure on a “Percent Change” (from prior month) basis with value -16.4%, last updated May 15, 2020:
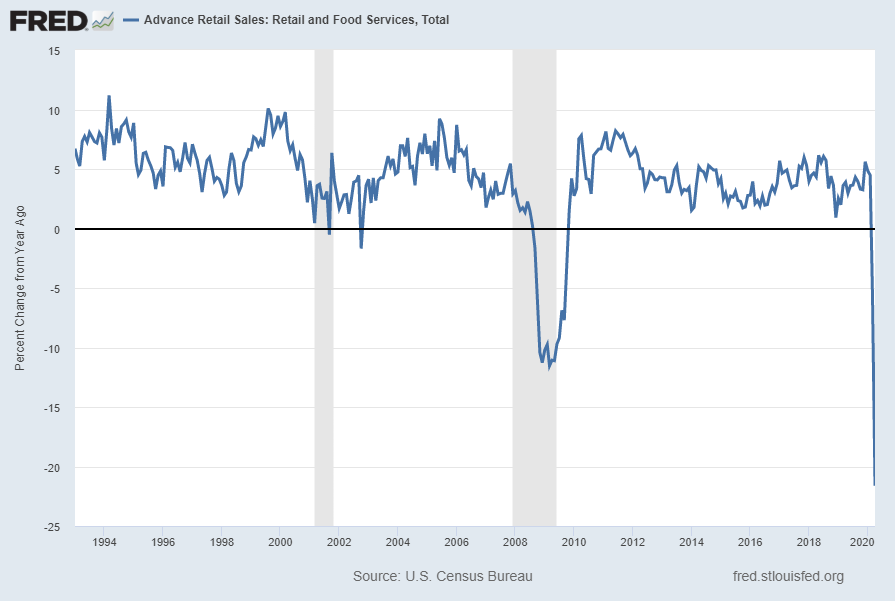
Displayed below is this same RSAFS measure on a “Percent Change From Year Ago” basis with value -21.6%, last updated May 15, 2020:
source: U.S. Census Bureau, Advance Retail Sales: Retail and Food Services, Total [RSAFS], retrieved from FRED, Federal Reserve Bank of St. Louis; accessed June 9, 2020: https://fred.stlouisfed.org/series/RSAFS
__
Value of Manufacturers’ New Orders for Consumer Goods Industries (ACOGNO)
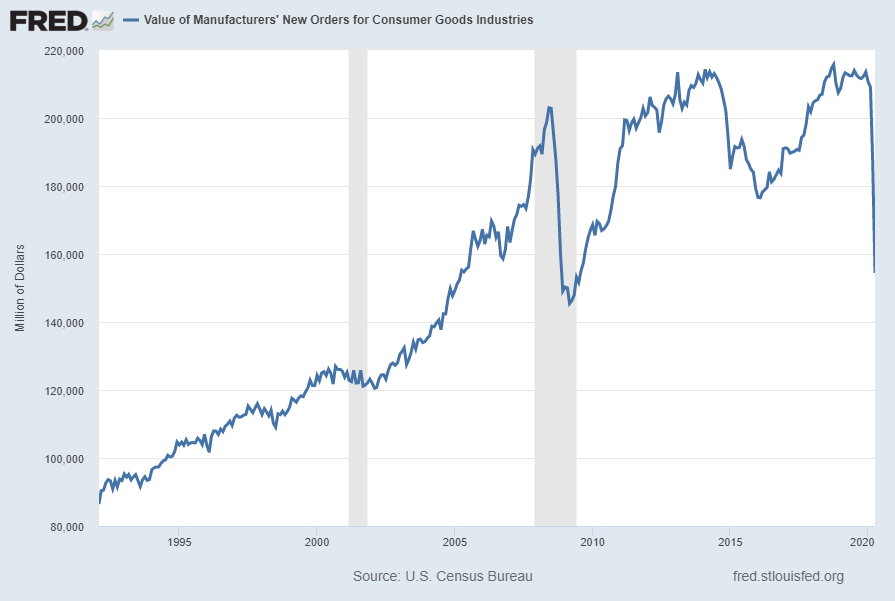
A measure for consumer goods exhibiting a recent weakening (on a “Percent Change From Year Ago” basis) growth trend is the “Value of Manufacturers’ New Orders for Consumer Goods Industries” (ACOGNO). Shown below is this measure with last value of $154,415 Million through April 2020 (last updated June 3, 2020):
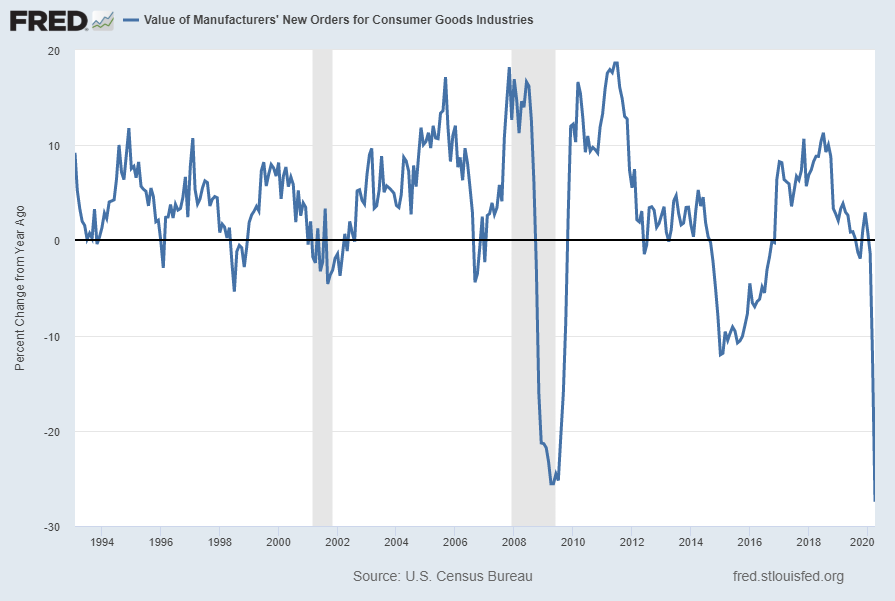
Displayed below is this same ACOGNO measure on a “Percent Change From Year Ago” basis with value -27.5%, last updated June 3, 2020:
source: U.S. Census Bureau, Value of Manufacturers’ New Orders for Consumer Goods Industries [ACOGNO], retrieved from FRED, Federal Reserve Bank of St. Louis; accessed June 10, 2020: https://fred.stlouisfed.org/series/ACOGNO
__
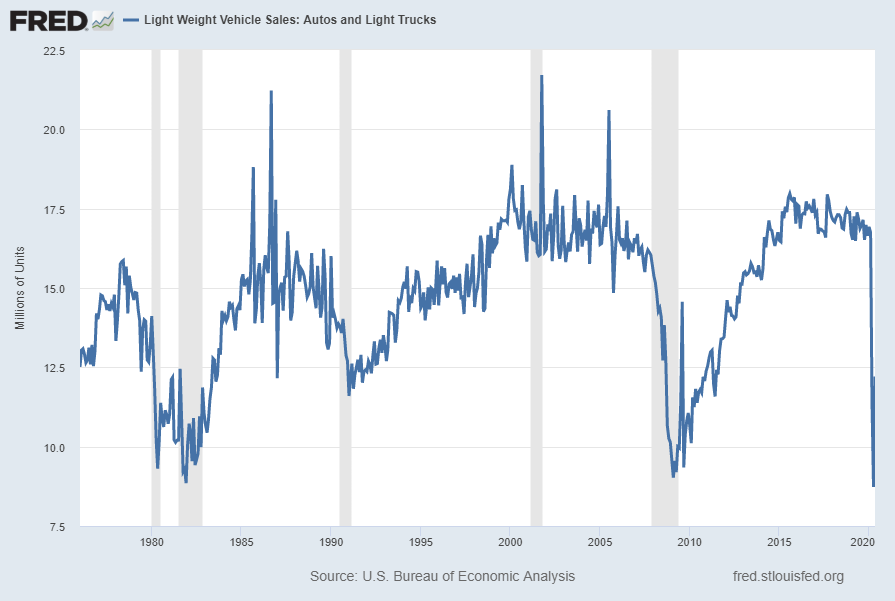
Light Weight Vehicle Sales: Autos and Light Trucks (ALTSALES)
Auto sales have an extensive impact on economic activity. Auto sales, according to the current reading (through May 2020, updated on June 5) is 12.213 million vehicles SAAR. As shown below, this is a substantial decline when viewed against recent sales trends:
As seen below, the decline seen in this same measure on a “Percent Change From Year Ago” basis, with value -29.7%, is highly notable over the shown time frame:
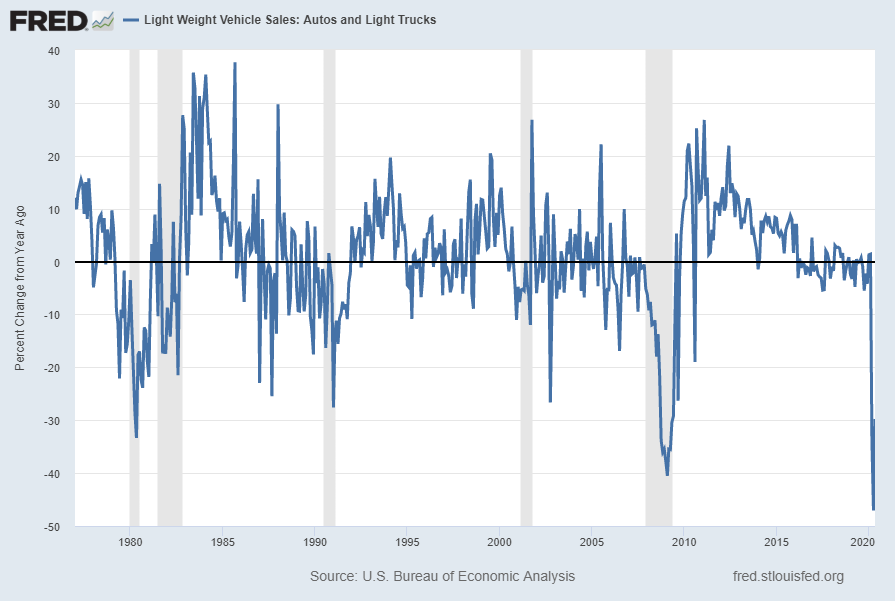
source: U.S. Bureau of Economic Analysis, Light Weight Vehicle Sales: Autos and Light Trucks [ALTSALES], retrieved from FRED, Federal Reserve Bank of St. Louis; accessed June 11, 2020: https://fred.stlouisfed.org/series/ALTSALES
__
Other Indicators
As mentioned previously, many other indicators discussed on this site indicate economic weakness or economic contraction, if not outright (gravely) problematical economic conditions.
_____
The Special Note summarizes my overall thoughts about our economic situation
SPX at 3190.14 as this post is written