U.S. Economic Indicators
Throughout this site there are many discussions of economic indicators. At this time, the readings of various indicators are especially notable. This post is the latest in a series of posts indicating U.S. economic weakness or a notably low growth rate.
While many U.S. economic indicators – including GDP – are indicating economic growth, others depict (or imply) various degrees of weak growth or economic contraction. As seen in the August 2019 Wall Street Journal Economic Forecast Survey the consensus (average estimate) among various economists is for 2.2% GDP growth in 2019 and 1.8% GDP growth in 2020. However, there are other broad-based economic indicators that seem to imply a weaker growth rate.
As well, it should be remembered that GDP figures can be (substantially) revised.
Charts Indicating U.S. Economic Weakness
Below are a small sampling of charts that depict weak growth or contraction, and a brief comment for each:
Total Federal Receipts
“Total Federal Receipts” growth continues to be intermittent in nature since 2015. As well, the level of growth does not seem congruent to the (recent) levels of economic growth as seen in aggregate measures such as Real GDP.
“Total Federal Receipts” through July had a last monthly value of $251,348 Million. Shown below is the measure displayed on a “Percent Change From Year Ago” basis with value 11.6%, last updated August 12, 2019:
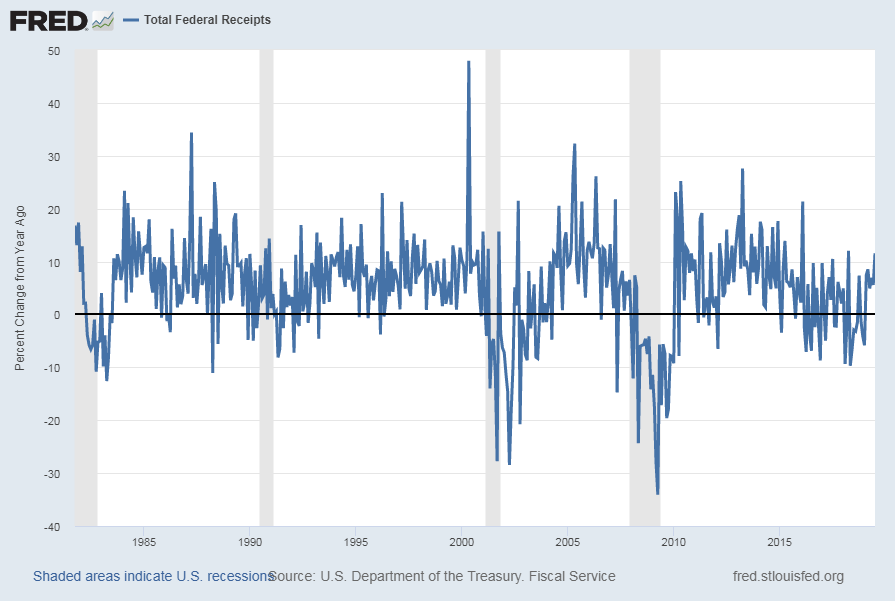
source: U.S. Department of the Treasury. Fiscal Service, Total Federal Receipts [MTSR133FMS], retrieved from FRED, Federal Reserve Bank of St. Louis; accessed August 12, 2019:
https://fred.stlouisfed.org/series/MTSR133FMS
__
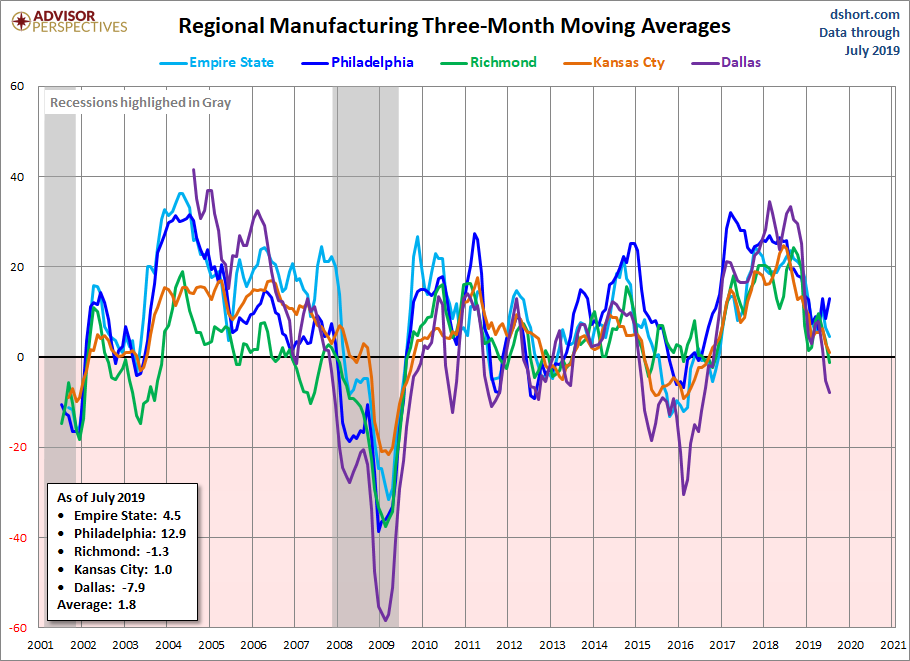
Regional Manufacturing Surveys
Various Federal Reserve regional manufacturing surveys are indicating either a significant weakening in growth or a decline in various aspects of activity.
Below is a chart of various regional manufacturing surveys, depicted on a 3-month moving average, from Doug Short’s site post of July 29, 2019 titled “July Regional Fed Manufacturing Overview“:
__
Value of Manufacturers’ New Orders for Consumer Goods Industries (ACOGNO)
A measure for consumer goods exhibiting a weakening (on a YoY basis) growth trend is the “Value of Manufacturers’ New Orders for Consumer Goods Industries” (ACOGNO). Shown below is this measure (with last value of $211,862 Million through June) displayed on a “Percent Change From Year Ago” basis with value .3%, last updated August 2, 2019:
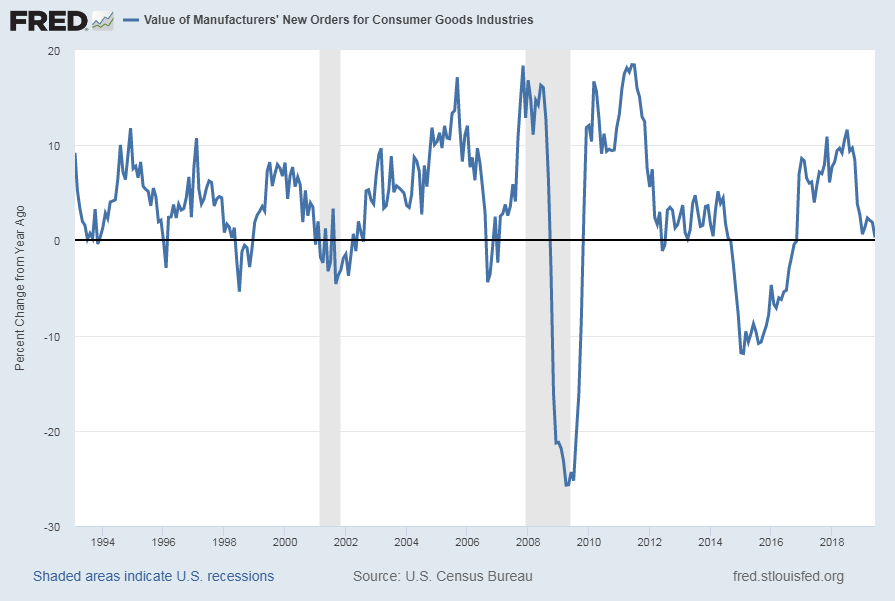
source: U.S. Census Bureau, Value of Manufacturers’ New Orders for Consumer Goods Industries [ACOGNO], retrieved from FRED, Federal Reserve Bank of St. Louis; accessed August 12, 2019: https://fred.stlouisfed.org/series/ACOGNO
__
The Yield Curve
Many people believe that the Yield Curve is a leading economic indicator for the United States economy.
On March 1, 2010, I wrote a post on the issue, titled “The Yield Curve As A Leading Economic Indicator.”
While I continue to have the stated reservations regarding the “Yield Curve” as an indicator, I do believe that it should be monitored.
Various portions of the U.S. Yield Curve have been showing intermittent or prolonged inversions. Below is the spread between 10-Year Treasury Constant Maturity and the 3-Month Treasury Constant Maturity from 1982 through the August 9, 2019 value, currently showing a value of -.26: (10-Year Treasury Yield (FRED DGS10) of 1.74% , 3-Month Treasury Yield (FRED DGS3MO) of 2.00%):
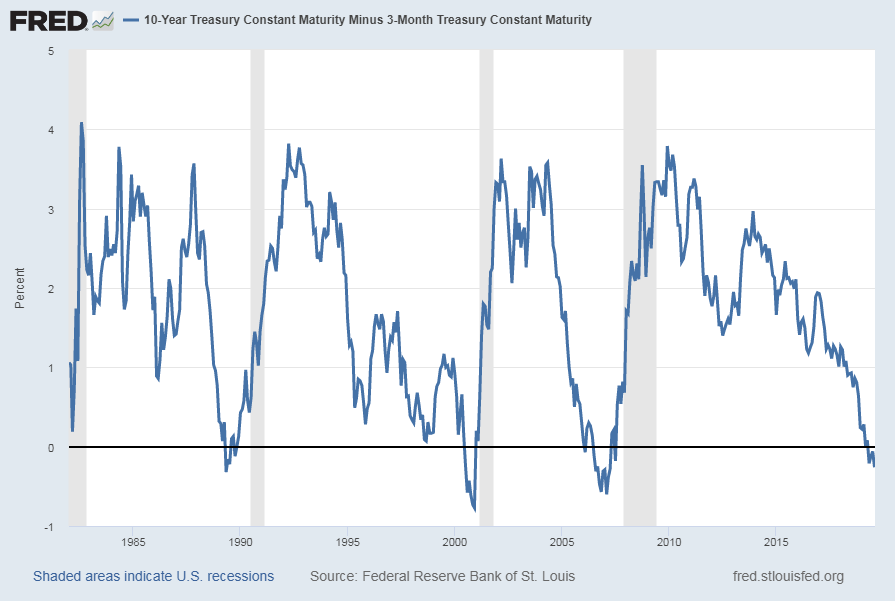
source: Federal Reserve Bank of St. Louis, 10-Year Treasury Constant Maturity Minus 3-Month Treasury Constant Maturity [T10Y3M], retrieved from FRED, Federal Reserve Bank of St. Louis; accessed August 12, 2019: https://fred.stlouisfed.org/series/T10Y3M
__
Total Construction Spending (TTLCONS)
Various measures of construction continue to exhibit weakness. “Total Construction Spending” is one measure of construction exhibiting a contraction on a “Percent Change From Year Ago” basis. This measure through June had a last value of $1,286,997 Million (SAAR). Shown below is the measure displayed on a “Percent Change From Year Ago” basis with a value of -2.1%, last updated August 1, 2019:
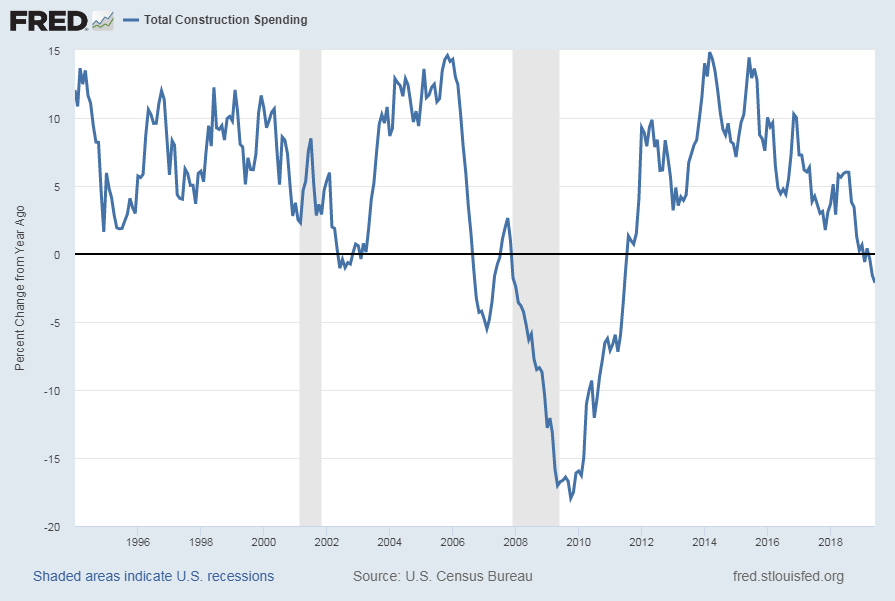
source: U.S. Census Bureau, Total Construction Spending [TTLCONS], retrieved from FRED, Federal Reserve Bank of St. Louis; accessed August 12, 2019: https://fred.stlouisfed.org/series/TTLCONS
__
Other Indicators
As mentioned previously, many other indicators discussed on this site indicate economic weakness or economic contraction, if not outright (gravely) problematical economic conditions.
_____
The Special Note summarizes my overall thoughts about our economic situation
SPX at 2882.70 as this post is written