For reference purposes, here is Total Household Net Worth from a long-term perspective (from 1945:Q4 through 2018:Q1). The last value (as of the June 7, 2018 update) is $100.768344 Trillion:
(click on each chart to enlarge image)
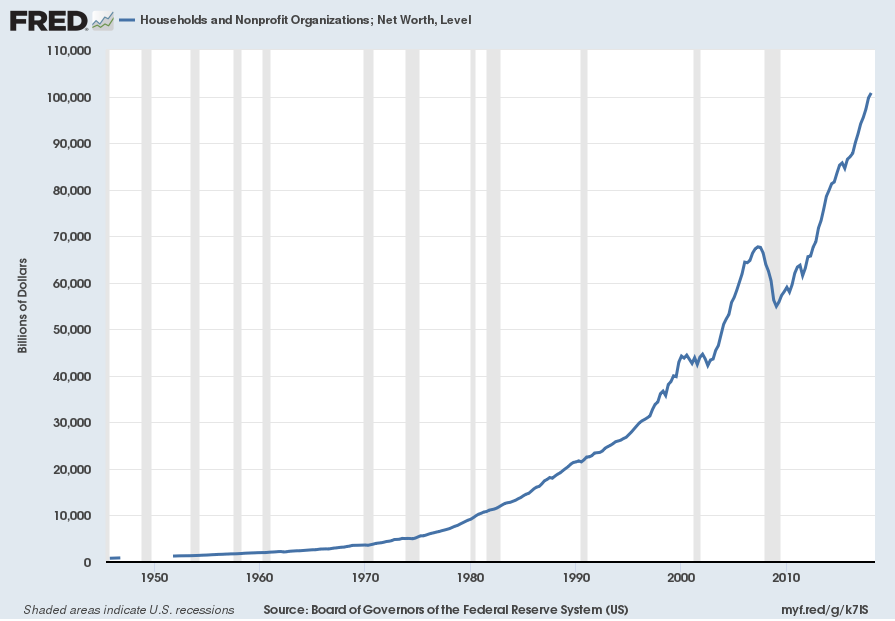
–
Also of interest is the same metric presented on a “Percent Change from a Year Ago” basis:
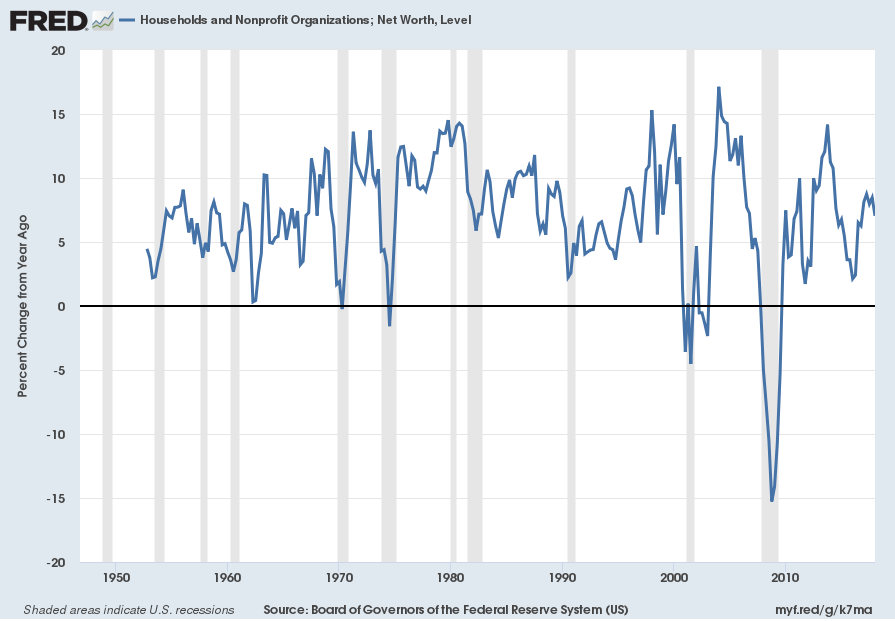
Data Source: FRED, Federal Reserve Economic Data, Board of Governors of the Federal Reserve System; accessed June 7, 2018:
http://research.stlouisfed.org/fred2/series/TNWBSHNO
_____
The Special Note summarizes my overall thoughts about our economic situation
SPX at 2770.37 as this post is written