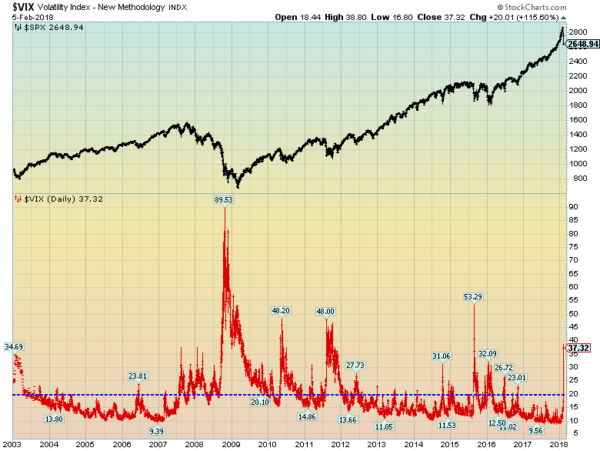
For reference purposes, below is a chart of the S&P500 and VIX from year 2003 through Monday’s (February 5, 2018) close. The closing price for the S&P500 was 2648.94 and the VIX had a closing value of 37.32. A dashed blue line depicts the VIX value of 20. Price labels are also shown:
(click on chart to enlarge image)(chart courtesy of StockCharts.com; chart creation and annotation by the author)
_____
The Special Note summarizes my overall thoughts about our economic situation
SPX at 2648.94 as this post is written