The following chart is from the CalculatedRisk post of December 7, 2017 titled “Fed’s Flow of Funds: Household Net Worth increased in Q3.” It depicts Total Household Net Worth as a Percent of GDP. The underlying data is from the Federal Reserve’s Z.1 report, “Financial Accounts of the United States“:
(click on chart to enlarge image)
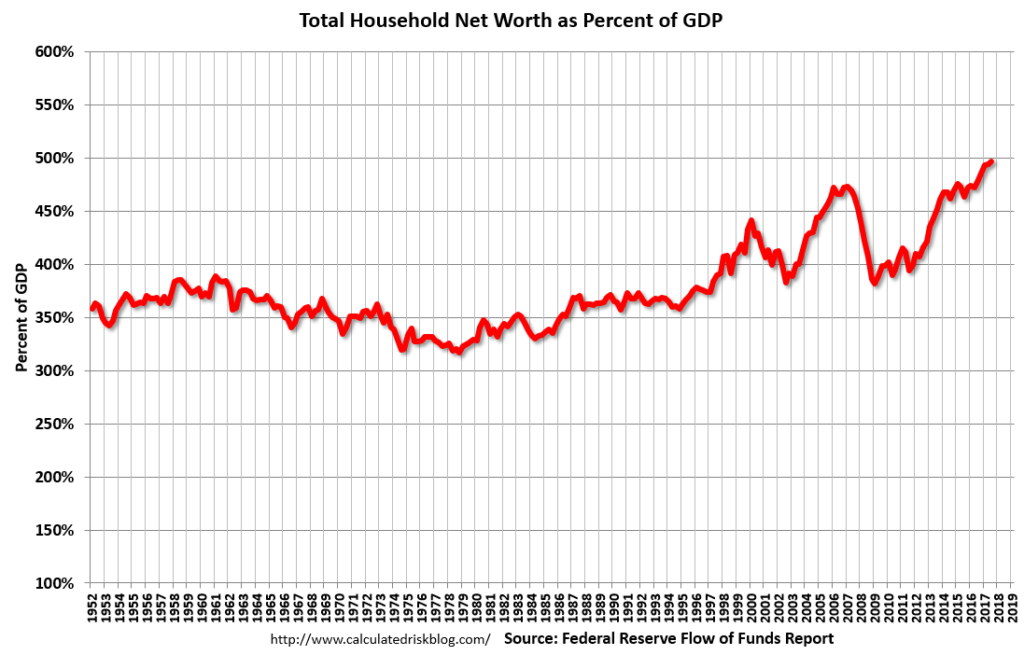
As seen in the above-referenced CalculatedRisk post:
The net worth of households and nonprofits rose to $96.9 trillion during the third quarter of 2017. The value of directly and indirectly held corporate equities increased $1.1 trillion and the value of real estate increased $0.4 trillion.
also:
The Fed estimated that the value of household real estate increased to $24.2 trillion in Q3. The value of household real estate is now above the bubble peak in early 2006 – but not adjusted for inflation, and this also includes new construction.
As I have written in previous posts concerning this Household Net Worth (as a percent of GDP) topic:
As one can see, the first outsized peak was in 2000, and attained after the stock market bull market / stock market bubbles and economic strength. The second outsized peak was in 2007, right near the peak of the housing bubble as well as near the stock market peak.
also:
I could extensively write about various interpretations that can be made from this chart. One way this chart can be interpreted is a gauge of “what’s in it for me?” as far as the aggregated wealth citizens are gleaning from economic activity, as measured compared to GDP.
_____
The Special Note summarizes my overall thoughts about our economic situation
SPX at 2636.98 as this post is written