For reference purposes, below are five charts that display growth in payroll employment, as depicted by the Total Nonfarm Payrolls measures (FRED data series PAYEMS).
PAYEMS, which is seasonally adjusted, is defined in Financial Reserve Economic Data [FRED] as:
All Employees: Total Nonfarm, commonly known as Total Nonfarm Payroll, is a measure of the number of U.S. workers in the economy that excludes proprietors, private household employees, unpaid volunteers, farm employees, and the unincorporated self-employed. This measure accounts for approximately 80 percent of the workers who contribute to Gross Domestic Product (GDP).
This measure provides useful insights into the current economic situation because it can represent the number of jobs added or lost in an economy. Increases in employment might indicate that businesses are hiring which might also suggest that businesses are growing. Additionally, those who are newly employed have increased their personal incomes, which means (all else constant) their disposable incomes have also increased, thus fostering further economic expansion.
Generally, the U.S. labor force and levels of employment and unemployment are subject to fluctuations due to seasonal changes in weather, major holidays, and the opening and closing of schools. The Bureau of Labor Statistics (BLS) adjusts the data to offset the seasonal effects to show non-seasonal changes: for example, women’s participation in the labor force; or a general decline in the number of employees, a possible indication of a downturn in the economy. To closely examine seasonal and non-seasonal changes, the BLS releases two monthly statistical measures: the seasonally adjusted All Employees: Total Nonfarm (PAYEMS) and All Employees: Total Nonfarm (PAYNSA), which is not seasonally adjusted.
The series comes from the ‘Current Employment Statistics (Establishment Survey).’
The source code is: CES0000000001
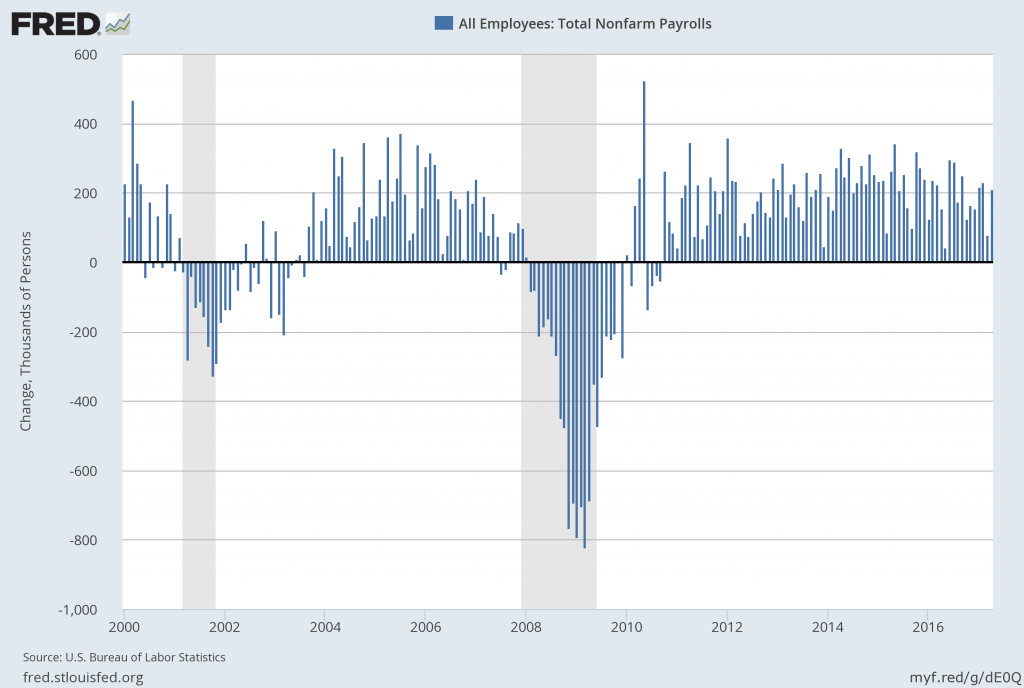
The first chart shows the monthly change in Total Nonfarm Payrolls from the year 2000 through the current report of April 2017:
(click on charts to enlarge images)
Data Source: FRED, Federal Reserve Economic Data, Federal Reserve Bank of St. Louis: All Employees: Total nonfarm [PAYEMS] ; U.S. Department of Labor: Bureau of Labor Statistics; accessed May 8, 2017;
https://research.stlouisfed.org/fred2/series/PAYEMS
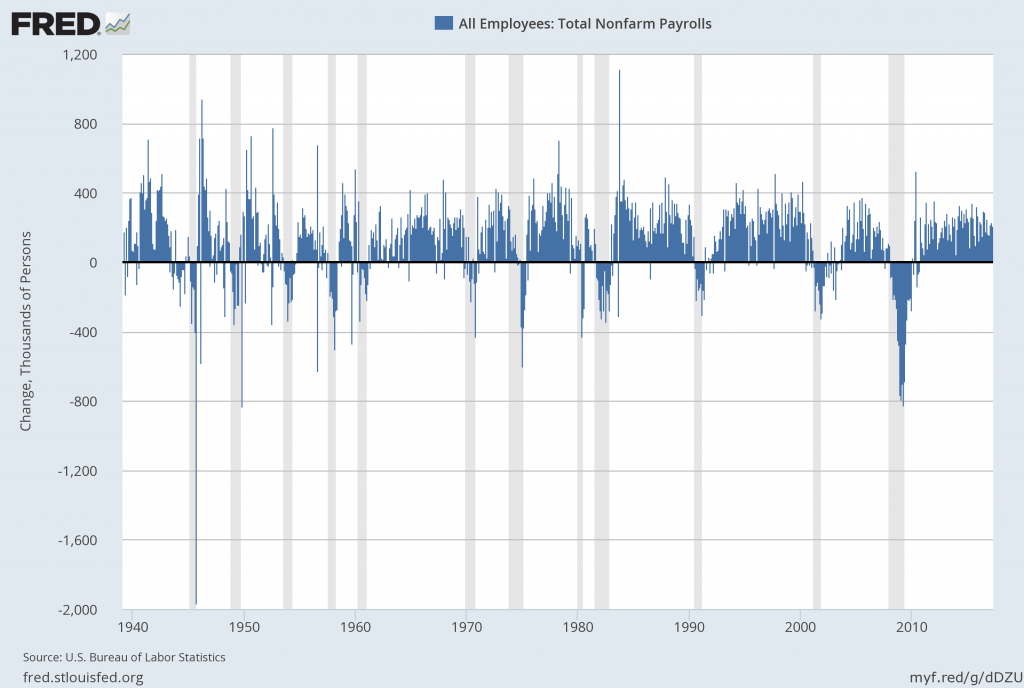
The second chart shows a longer-term chart of the same month-over-month change in Total Nonfarm Payrolls (reports of January 1940 through the present report of April 2017):
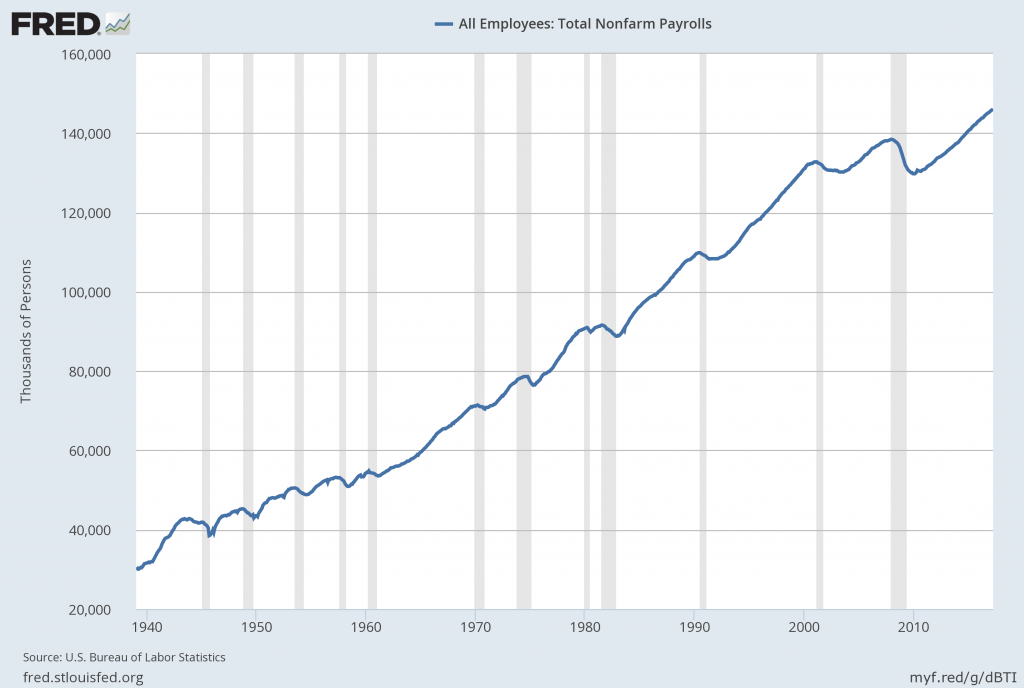
The third chart shows the aggregate number of Total Nonfarm Payrolls, from January 1939 – April 2017 (April 2017 value of 146.063 million):
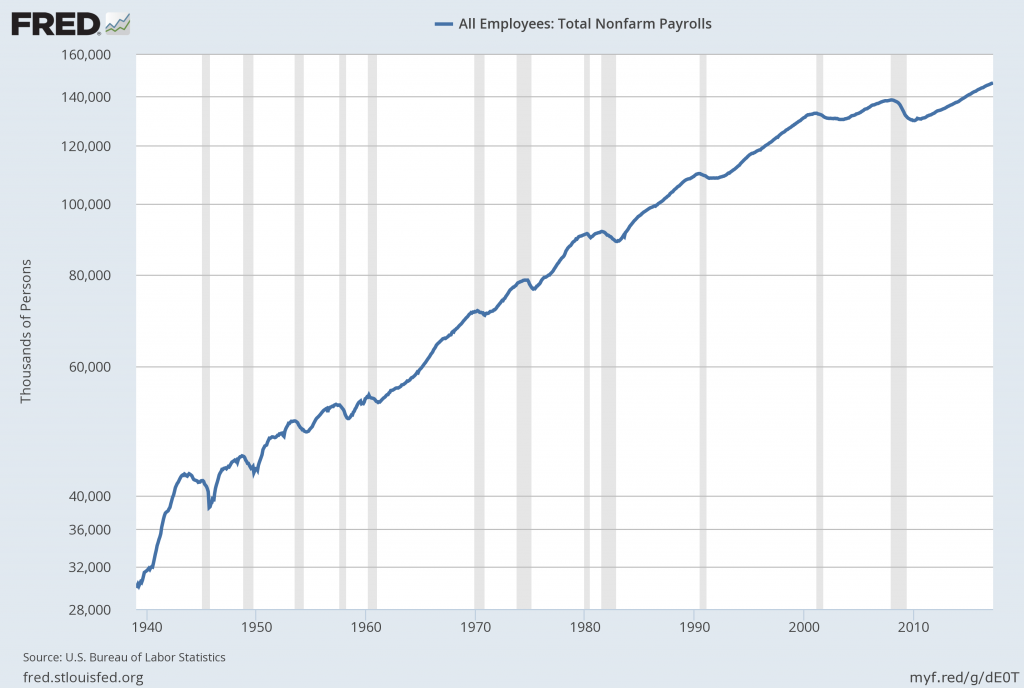
The fourth chart shows this same aggregate number of Total Nonfarm Payrolls measure as seen above but presented on a LOG scale:
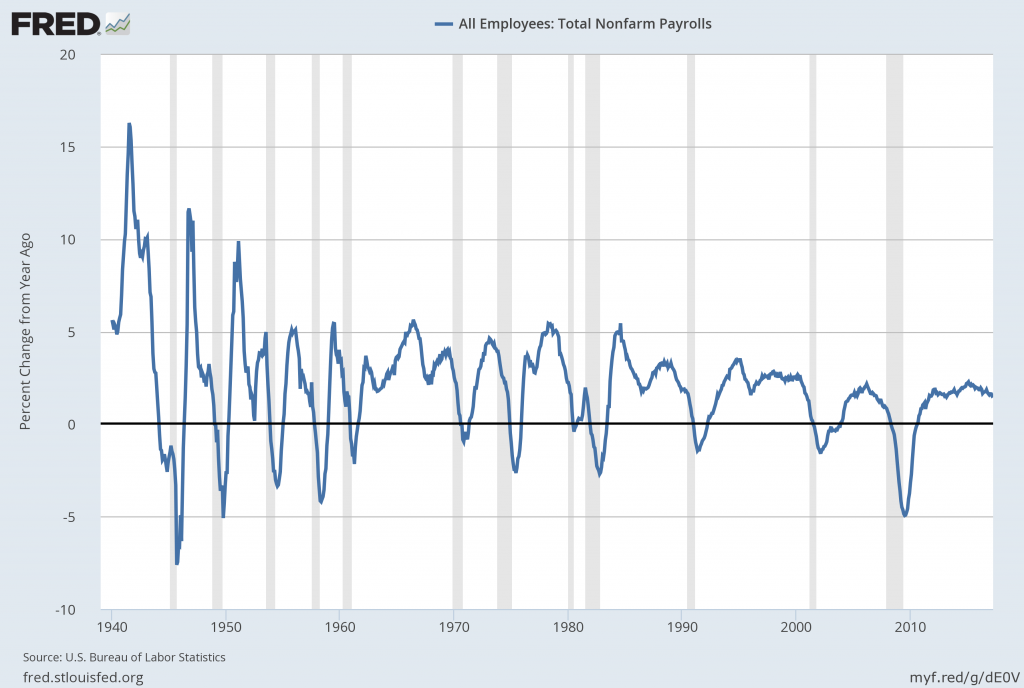
Lastly, the fifth chart shows the Total Nonfarm Payrolls number on a “Percent Change from Year Ago” basis from January 1940 – April 2017:
_________
I post various indicators and indices because I believe they should be carefully monitored. However, as those familiar with this blog are aware, I do not necessarily agree with what they depict or imply.
_____
The Special Note summarizes my overall thoughts about our economic situation
SPX at 2399.29 as this post is written