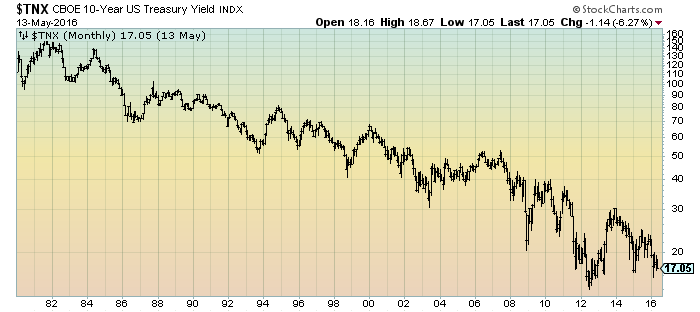
On Friday (May 13, 2016) the yield on the 10-Year Treasury closed at 1.705%.
As a reference, here is a long-term chart of the 10-Year Treasury yield since 1980, depicted on a monthly basis, LOG scale:
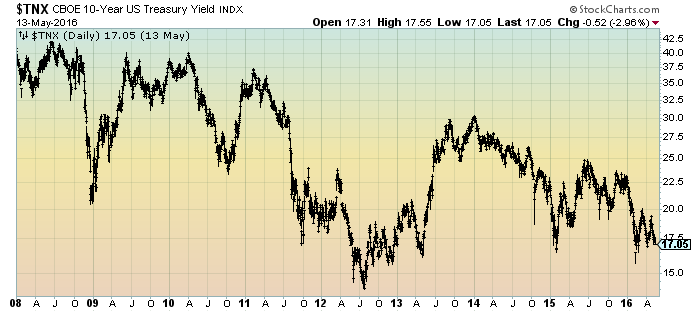
(click on charts to enlarge images)(charts courtesy of StockCharts.com; chart creation and annotation by the author)
Here is a long-term chart of the 10-Year Treasury yield since 2008, depicted on a daily basis, LOG scale:
_____
The Special Note summarizes my overall thoughts about our economic situation
SPX at 2046.61 as this post is written