Throughout this site there are many charts of economic indicators. At this time, the readings of these various indicators are especially notable. While many are still indicating economic growth, others depict (or imply) various degrees of economic weakness. Perhaps most prominent among those indicating economic growth is the First Quarter 2016 “Advance Estimate” of GDP (pdf) at 0.5%.
Below are a small sampling of charts that depict greater degrees of weakness and/or other worrisome trends, and a brief comment for each.
Manufacturing
As depicted by this chart showing various Federal Reserve Regional Manufacturing Indexes, there has been weakness in the recent readings:
source: Doug Short’s post of April 29, 2016, “Regional Fed Overview: April Still Negative, but Continuing to Decline.”
comment:
Various manufacturing statistics have recently been showing weakness. This is seen in many metrics, including the various Federal Reserve regional manufacturing surveys.
Other aspect of manufacturing trends, as seen in various indicators, include the Value of Manufacturers’ New Orders for Consumer Goods Industries, last updated May 4, 2016:
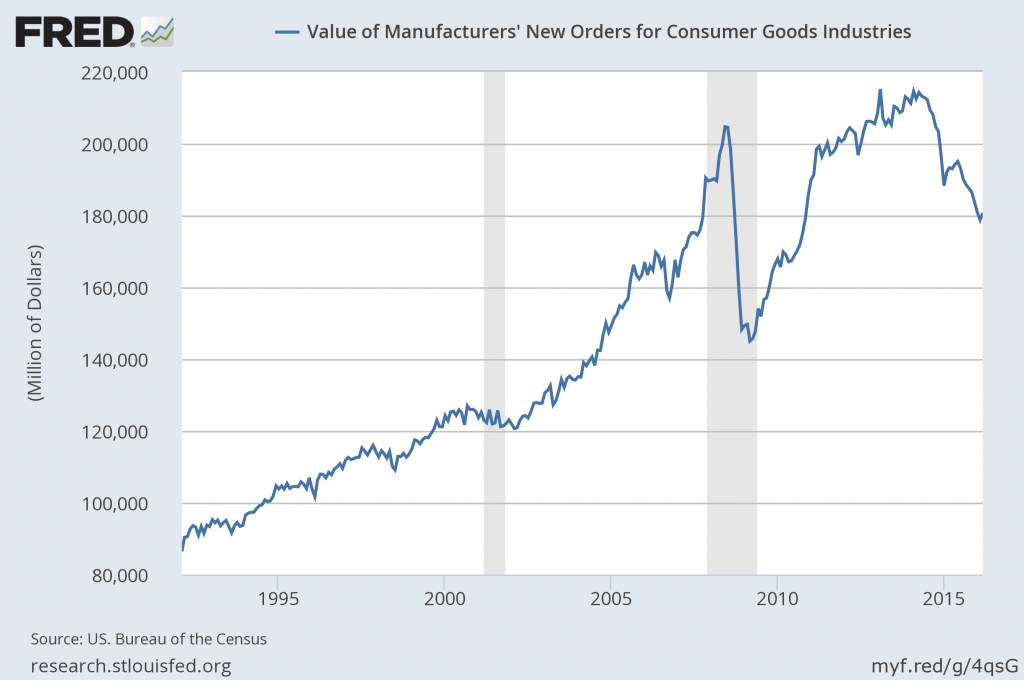
source: US. Bureau of the Census, Value of Manufacturers’ New Orders for Consumer Goods Industries [ACOGNO], retrieved from FRED, Federal Reserve Bank of St. Louis; accessed May 8, 2016:
https://research.stlouisfed.org/fred2/series/ACOGNO
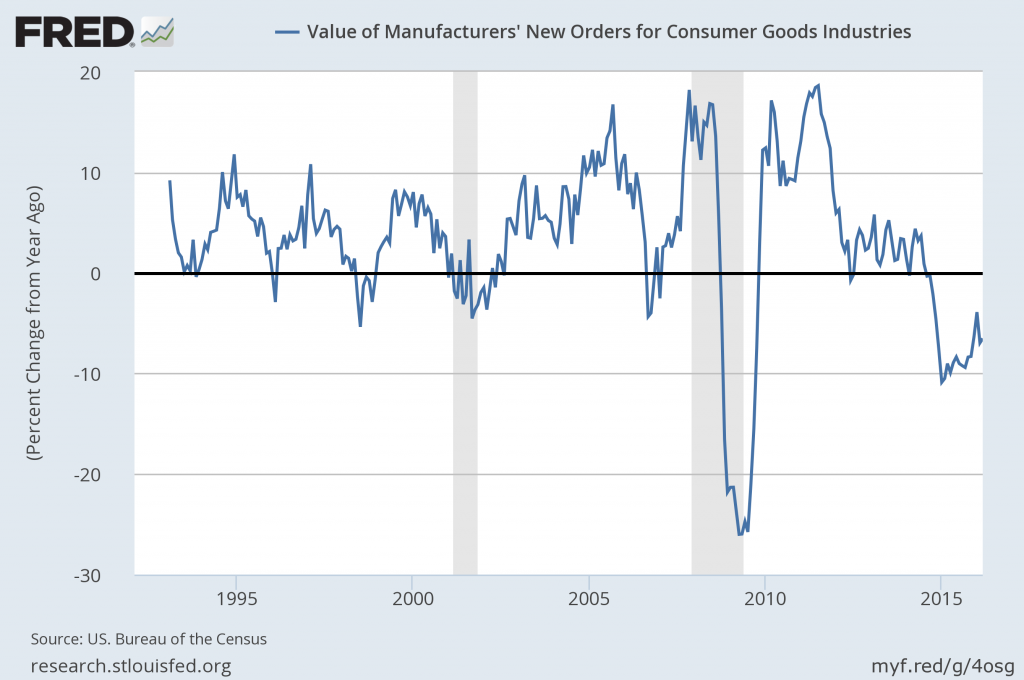
Here is the same measure on a “Percent Change From Year Ago” basis:
An additional concern is the seemingly (very) high levels of inventory, as seen in various measures, such as Total Business: Inventories to Sales Ratio, last updated April 13, 2016:
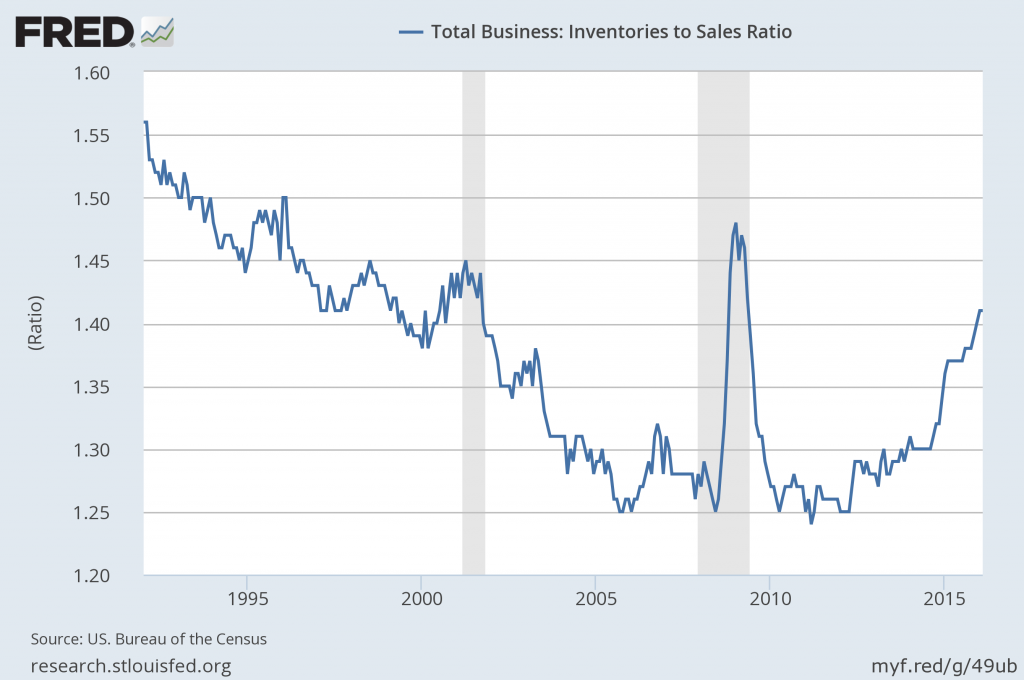
Source: US. Bureau of the Census, Total Business: Inventories to Sales Ratio [ISRATIO], retrieved from FRED, Federal Reserve Bank of St. Louis, accessed May 9, 2016:
https://research.stlouisfed.org/fred2/series/ISRATIO
__
Employment
Labor Force Participation Rate (last updated 5-6-16; value of 62.8%):
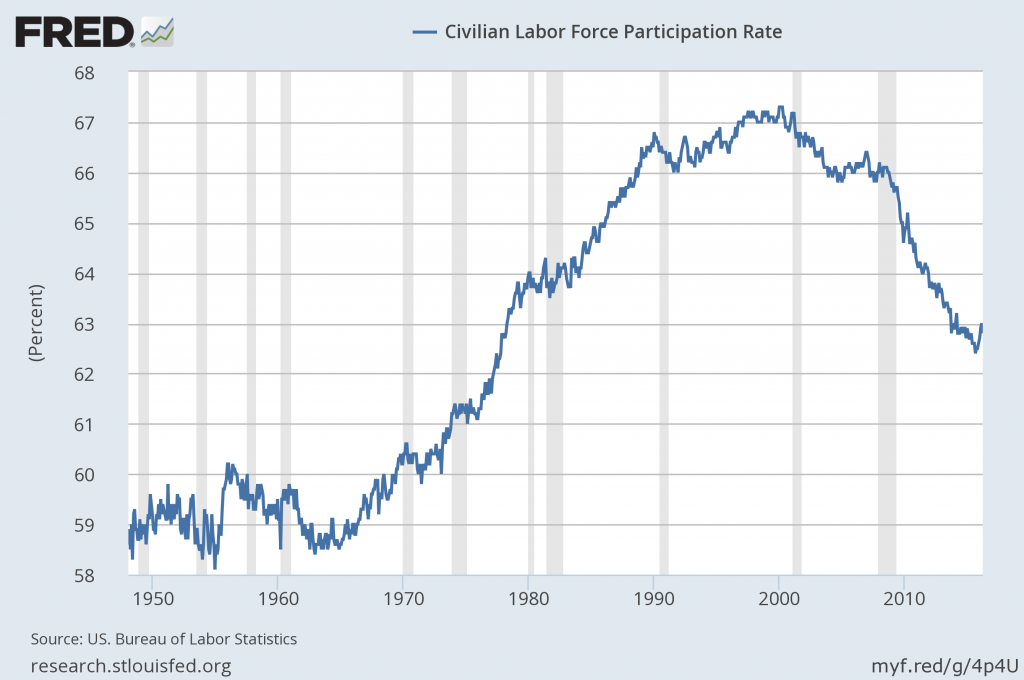
source: US. Bureau of Labor Statistics, Civilian Labor Force Participation Rate [CIVPART], retrieved from FRED, Federal Reserve Bank of St. Louis; accessed May 9, 2016:
https://research.stlouisfed.org/fred2/series/CIVPART/
comment:
I have written extensively concerning unemployment, as the current and future unemployment issue is of tremendous importance.
The consensus belief is that employment is robust, citing total nonfarm payroll growth and the current unemployment rate of 5.0%. However, my analyses indicate that the consensus interpretation of both of these metrics and the conclusion that employment is strong is incorrect. Of particular note is the unemployment rate, which indicates that unemployment is (very) low. Closer examination indicates that this metric is, for a number of reasons, highly misleading.
My analyses indicate that the underlying dynamics of the unemployment situation, including that of the Labor Force Participation Rate shown above, remain exceedingly worrisome, especially with regard to the future. These dynamics are numerous and complex, and greatly lack recognition and understanding, especially as how, from an “all-things-considered” standpoint they will progress in an economic and societal manner.
While I don’t believe that the Federal Reserve’s Labor Market Conditions Index (LMCI) is an accurate portrayal of the overall employment situation, it is notable in that, as opposed to the Unemployment Rate and Total Nonfarm Payrolls statistics, it appears to be indicating weakness. The LMCI is described as being “derived from a dynamic factor model that extracts the primary common variation from 19, seasonally-adjusted, labor market indicators.” A reference document is seen in the May 22, 2014 document titled “Assessing the Change in Labor Market Conditions.”
The latest update (as of May 9, 2016) is seen below:
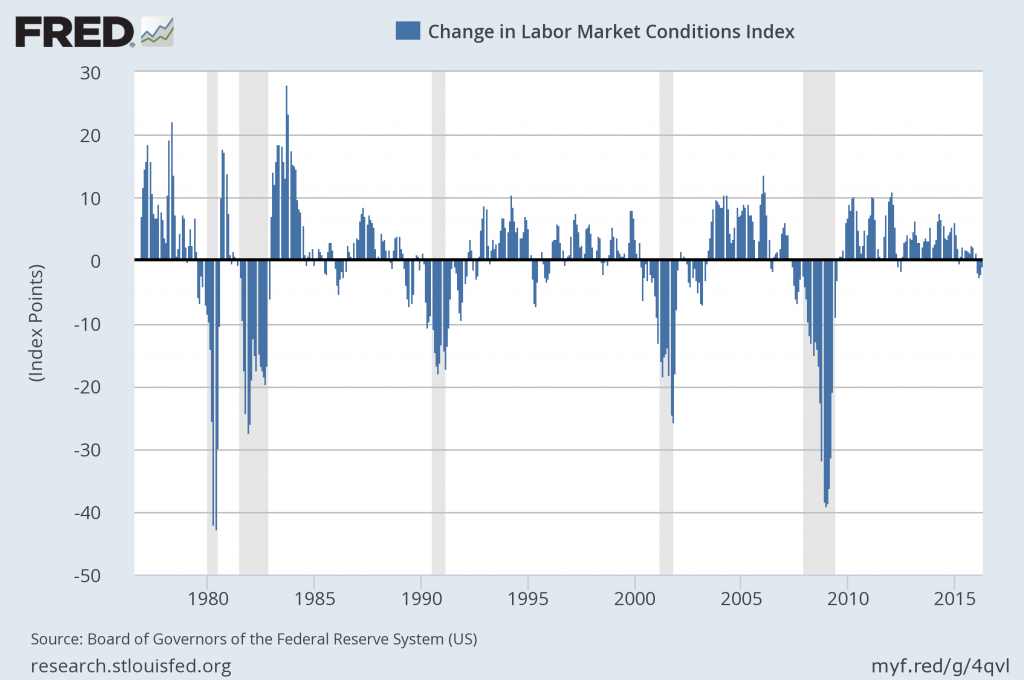
source: Board of Governors of the Federal Reserve System (US), Change in Labor Market Conditions Index [FRBLMCI], retrieved from FRED, Federal Reserve Bank of St. Louis, accessed May 9, 2016:
https://research.stlouisfed.org/fred2/series/FRBLMCI
__
Inflation Trends
The below chart shows inflation, as depicted by the PCE Price Index:
source: Doug Short’s April 29, 2016 PCE Update
comment:
As depicted above, the shortfall between the Federal Reserve’s stated inflation target (2% on the PCE Price Index) and the actual inflation reading continues. The level of current inflation and the possibility of deflation is a vastly complex topic, and as such isn’t suitably discussed in a brief manner. I have discussed the issue of deflation extensively as I continue to believe that outright sustained deflation will occur. As I have stated in past commentaries, I don’t believe that surveys or “market-based” measures concerning deflation will provide adequate “advance warning” of impending deflation.
_____
The Special Note summarizes my overall thoughts about our economic situation
SPX at 2071.84 as this post is written