While the concept of Americans’ incomes can be defined in a number of ways, many prominent measures continue to show disconcerting trends.
One prominent measure is the Employment Cost Index (ECI).
Here is a description from the BLS document titled “The Employment Cost Index: what is it?“:
The Employment Cost Index (ECI) is a quarterly measure of the change in the price of labor, defined as compensation per employee hour worked. Closely watched by many economists, the ECI is an indicator of cost pressures within companies that could lead to price inflation for finished goods and services. The index measures changes in the cost of compensation not only for wages and salaries, but also for an extensive list of benefits. As a fixed-weight, or Laspeyres, index, the ECI controls for changes occurring over time in the industrial-occupational composition of employment.
On April 29, 2016, the ECI for the first quarter was released. Here is an excerpt from the April 29, 2016 Wall Street Journal article titled “U.S. Employment Costs Improve at Modest Rate in First Quarter“:
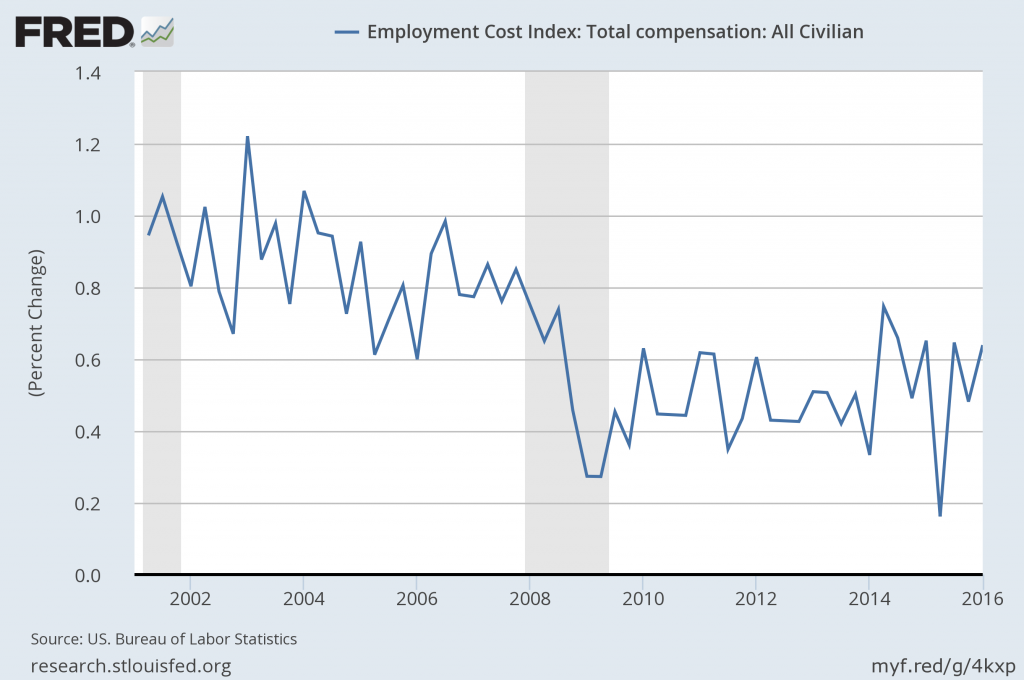
The employment-cost index, a broad measure of workers’ wages and benefits, grew a seasonally adjusted 0.6% during the first three months of 2016, the Labor Department said Friday. That matched the forecast of economists surveyed by The Wall Street Journal. The fourth-quarter gain was revised down to a 0.5% advance from an initial estimate of up 0.6%
Wages and salaries, reflecting more than two-thirds of compensation costs, advanced 0.7% last quarter. Benefits rose 0.5%.
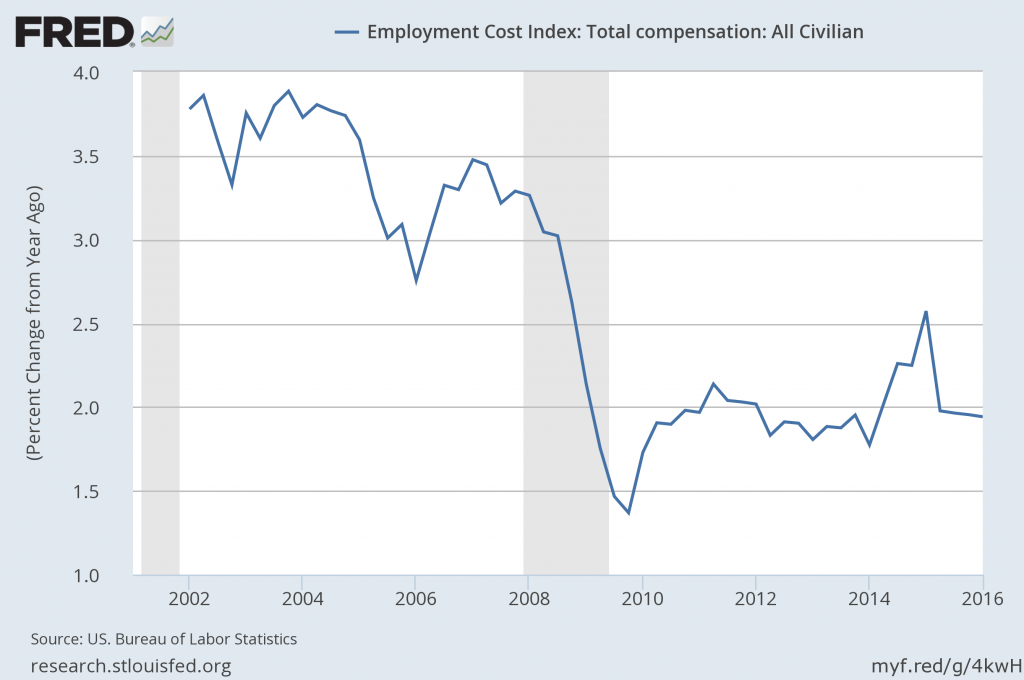
From a year earlier, total compensation increased 1.9% during the quarter, a very slight deceleration from the 2% annual gain recorded in each of the prior three quarters.
Below are three charts, updated on April 29, 2016 that depict various aspects of the ECI, which is seasonally adjusted (SA):
The first depicts the ECI, with a value of 126.0:
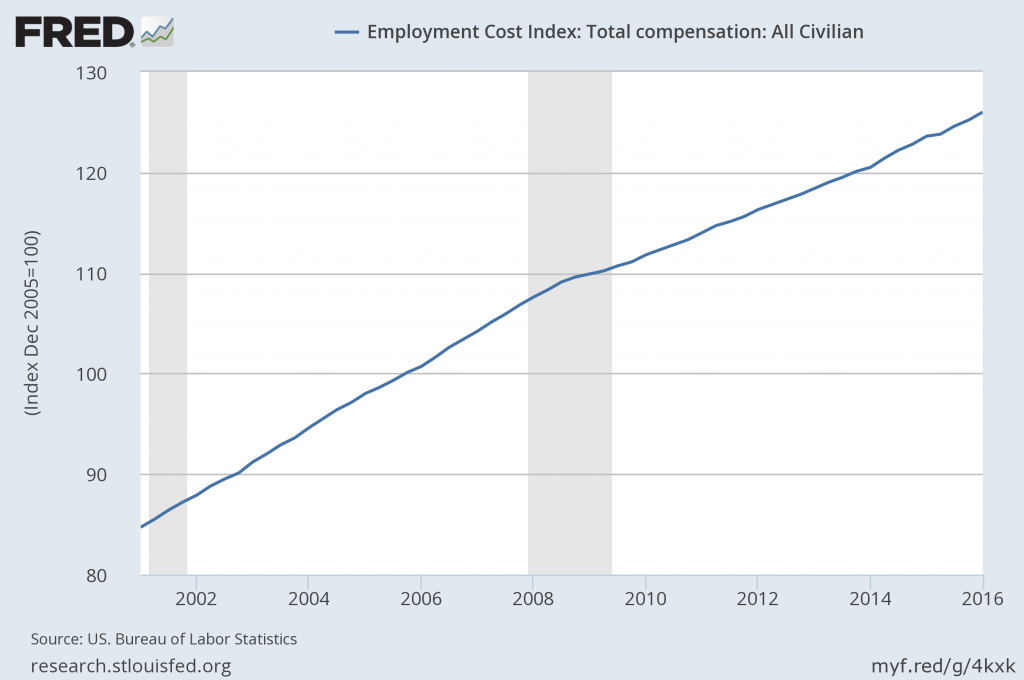
source: US. Bureau of Labor Statistics, Employment Cost Index: Total compensation: All Civilian[ECIALLCIV], retrieved from FRED, Federal Reserve Bank of St. Louis, accessed April 29, 2016:
https://research.stlouisfed.org/fred2/series/ECIALLCIV/
The second chart depicts the ECI on a “Percent Change from Year Ago” basis:
The third chart depicts the ECI on a “Percent Change” (from last quarter) basis:
_____
The Special Note summarizes my overall thoughts about our economic situation
SPX at 2071.09 as this post is written