Yesterday (February 11, 2016) the yield on the 10-Year Treasury went below 1.60%, before closing at 1.644%.
As a reference, here is a long-term chart of the 10-Year Treasury yield since 1980, depicted on a monthly basis, LOG scale, with price labels:
(click on charts to enlarge images)(charts courtesy of StockCharts.com; chart creation and annotation by the author)
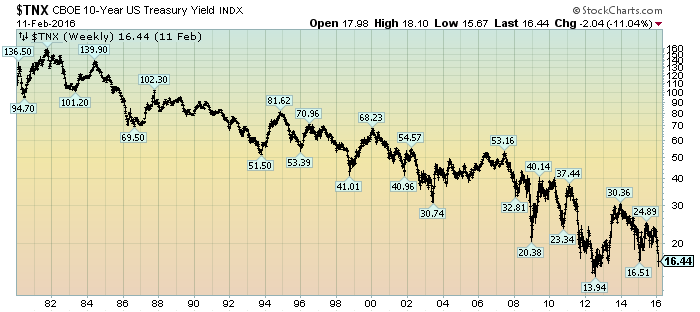
Here is a long-term chart of the 10-Year Treasury yield since 2005, depicted on a weekly basis, LOG scale, with price labels:

_____
The Special Note summarizes my overall thoughts about our economic situation
SPX at 1840.78 as this post is written