While the concept of Americans’ incomes can be defined in a number of ways, many prominent measures continue to show disconcerting trends.
One prominent measure is the Employment Cost Index (ECI).
Here is a description from the BLS document titled “The Employment Cost Index: what is it?“:
The Employment Cost Index (ECI) is a quarterly measure of the change in the price of labor, defined as compensation per employee hour worked. Closely watched by many economists, the ECI is an indicator of cost pressures within companies that could lead to price inflation for finished goods and services. The index measures changes in the cost of compensation not only for wages and salaries, but also for an extensive list of benefits. As a fixed-weight, or Laspeyres, index, the ECI controls for changes occurring over time in the industrial-occupational composition of employment.
On January 29, 2016, the ECI for the fourth quarter was released. Here is an excerpt from the January 29, 2016 Wall Street Journal article titled “U.S. Employment Costs Rose .6%, Little Sign of Wage Pressure“:
The employment-cost index, a broad measure of workers’ wages and benefits, grew 0.6% in the final three months of 2015, the Labor Department said Friday. That matched the prior quarter’s growth and fell in line with expectations of economists surveyed by The Wall Street Journal.
Wages and salaries, reflecting more than two-thirds of compensation costs, grew 0.6% last quarter. Benefits rose 0.7%.
Despite steady income growth in recent quarters, Americans aren’t seeing the kind of boost in their paychecks that would be expected given the long run of steady job growth. Overall compensation rose 2% last year, with wages and salaries up 2.1%, too modest to significantly lift Americans’ living standards and fuel stronger economic growth.
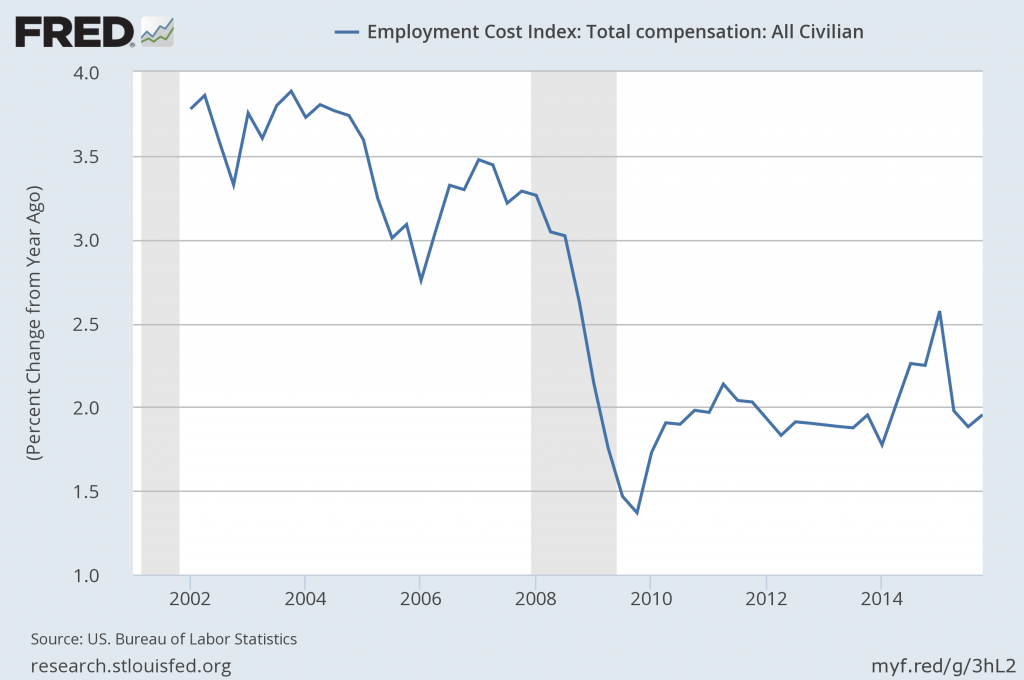
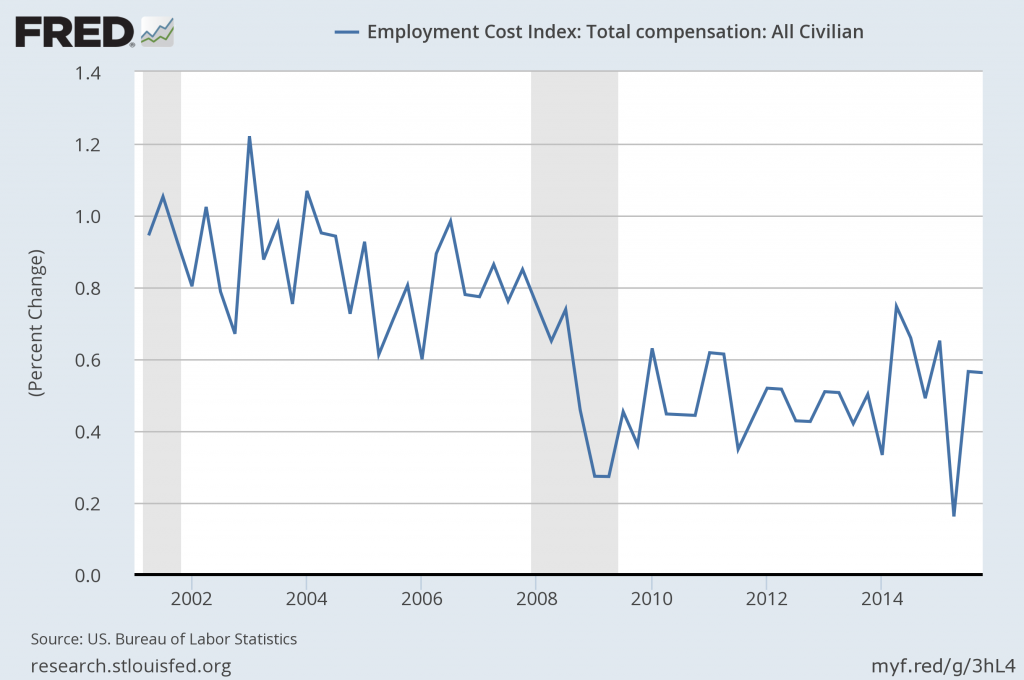
Below are three charts, updated on January 29, 2016 that depict various aspects of the ECI.
The first depicts the ECI, with a value of 125.2:
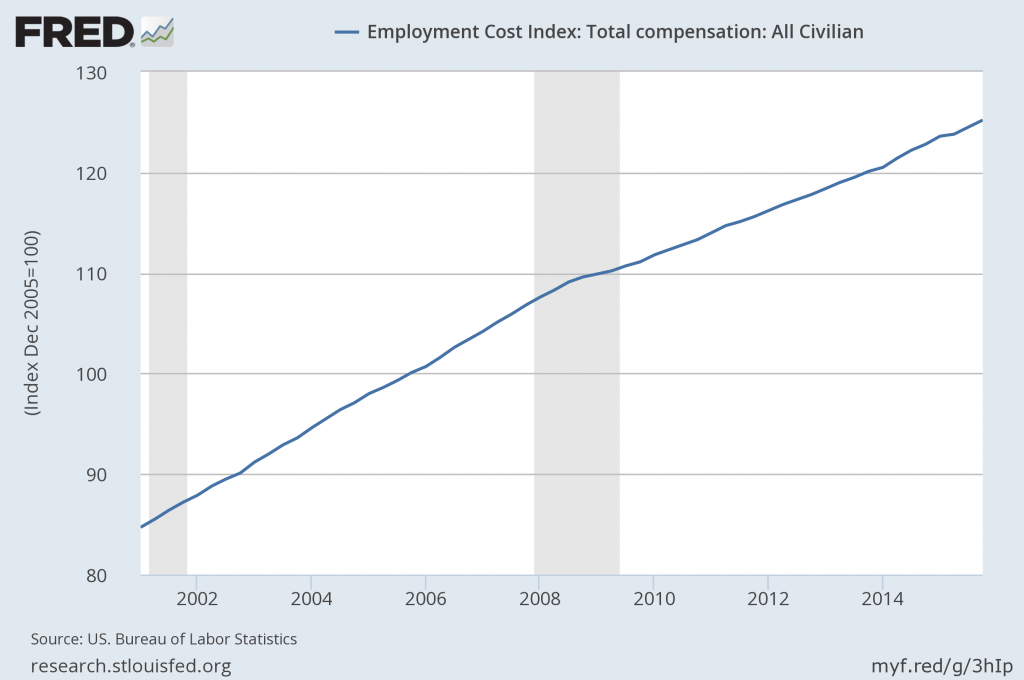
source: US. Bureau of Labor Statistics, Employment Cost Index: Total compensation: All Civilian[ECIALLCIV], retrieved from FRED, Federal Reserve Bank of St. Louis, accessed January 29, 2016:
https://research.stlouisfed.org/fred2/series/ECIALLCIV/
The second chart depicts the ECI on a “Percent Change from Year Ago” basis:
The third chart depicts the ECI on a “Percent Change” (from last quarter) basis:
_____
The Special Note summarizes my overall thoughts about our economic situation
SPX at 1915.97 as this post is written