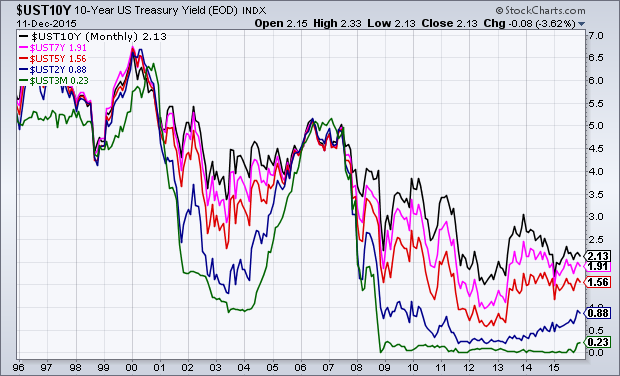
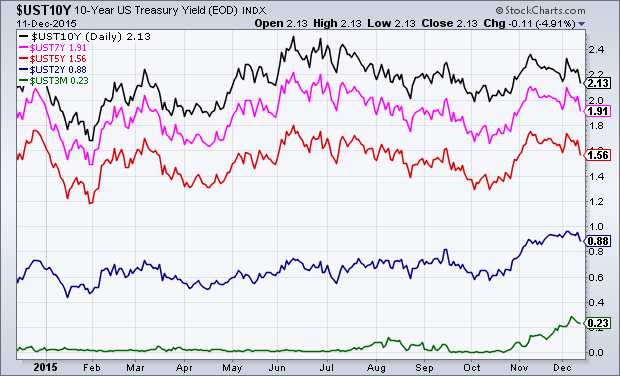
For references purposes, below are two charts that show the trend in interest rates for various Treasuries, including the 3-Month, 2-Year, 5-Year, 7-Year, and 10-Year.
A chart showing the interest rate trends of the last 20 years, on a monthly basis:
(click on chart to enlarge image)(chart courtesy of StockCharts.com; chart creation and annotation by the author)
A chart showing the interest rate trends of the last year, on a daily basis:
(click on chart to enlarge image)(chart courtesy of StockCharts.com; chart creation and annotation by the author)
_____
The Special Note summarizes my overall thoughts about our economic situation
SPX at 2012.37 as this post is written