Employment and unemployment statistics can be interpreted in various manners, and as such the resulting conclusions often vary. Due to the importance to both individuals and the economy at large, the overall topic of unemployment remains hotly contested.
At this point, it is widely recognized that recent “job gains” have been strong, and that the overall employment situation is getting stronger. Various media sources have compared recent job gains to those seen in the 1990s, including this excerpt from a February 6 Bloomberg article:
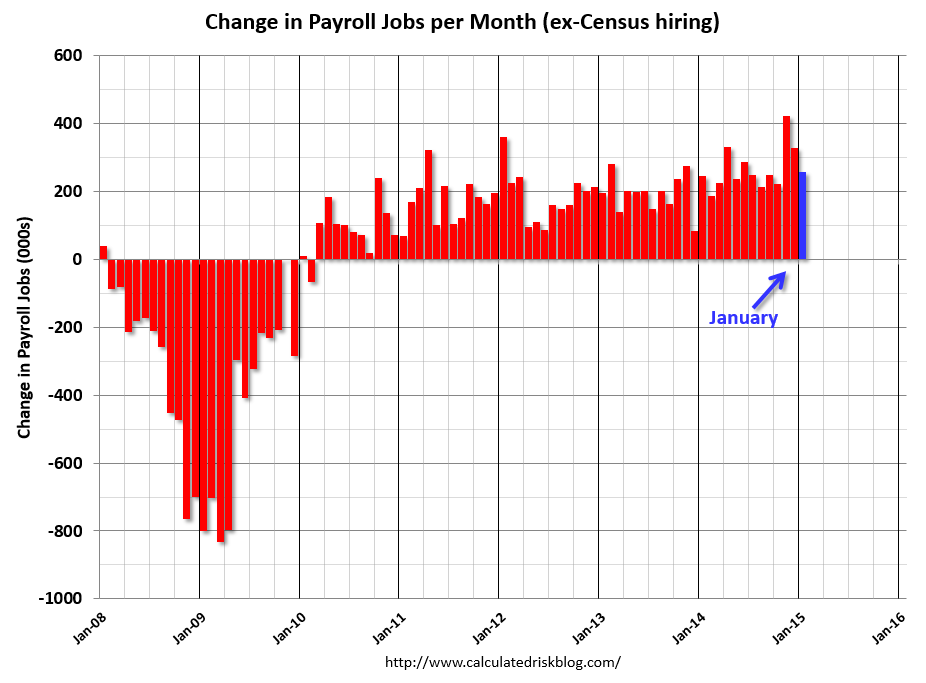
Payroll gains averaged 336,000 over the last three months, the strongest since a comparable period ended in November 1997.
For reference, here is a chart of monthly gains from the CalculatedRisk post of February 6, 2015, titled “January Unemployment Report: 257,000 Jobs, 5.7% Unemployment Rate“:
Furthermore, Gallup’s U.S. Job Creation Index shows steady gains, as seen in the February 6 post titled “U.S. Job Creation Index Lingers Near Seven-Year High.”
However, is it true that the job market is “strong” and is poised for additional robust and sustainable gains, as seen in the February 7 Wall Street Journal article titled “Job Market Looks Ripe for Liftoff“? There remains a variety of statistics that indicate highly disconcerting aspects, and as such there may be reasons to believe that gains in the employment situation are either not as robust as widely believed or that the purported recent gains are (substantially or totally) a mirage when compared to the “true” underlying condition.
As well, with regard to the future employment situation, there exists an array of highly worrisome dynamics. While these many dynamics are numerous and many are complex – and as such aren’t suitably discussed in a brief manner – below are various comments.
While there are many types of unemployment statistics, and even more portraying accompanying income trends, the official Unemployment Rate (U-3) remains the most recognized and disseminated unemployment figure. Currently that rate is 5.7%.
However, as I continue to believe that this figure is (highly) suboptimal for various reasons, I tend to focus on a broader mix of unemployment statistics. One set of statistics I follow closely is seen in the “3 Critical Unemployment Charts” update.
Another unemployment measure that I have found notable is the “Not in (The) Labor Force” statistic. Here is the description from the Bureau of Labor Statistics (BLS) page titled “Current Population Survey Frequently Asked Questions“:
Who is not in the labor force?
Persons not in the labor force are those who are not classified as employed or unemployed during the survey reference week.
Labor force measures are based on the civilian noninstitutional population 16 years old and over. (Excluded are persons under 16 years of age, all persons confined to institutions such as nursing homes and prisons, and persons on active duty in the Armed Forces.) The labor force is made up of the employed and the unemployed. The remainder—those who have no job and are not looking for one—are counted as “not in the labor force.” Many who are not in the labor force are going to school or are retired. Family responsibilities keep others out of the labor force.
Commentary from the Wall Street Journal editorial of October 23, 2013 concerning this statistic is titled “90 Million Americans Not Working.”
The current figure, last updated on February 6, 2015 depicting data through January 2015, is 93.674 million people (Not Seasonally Adjusted) :
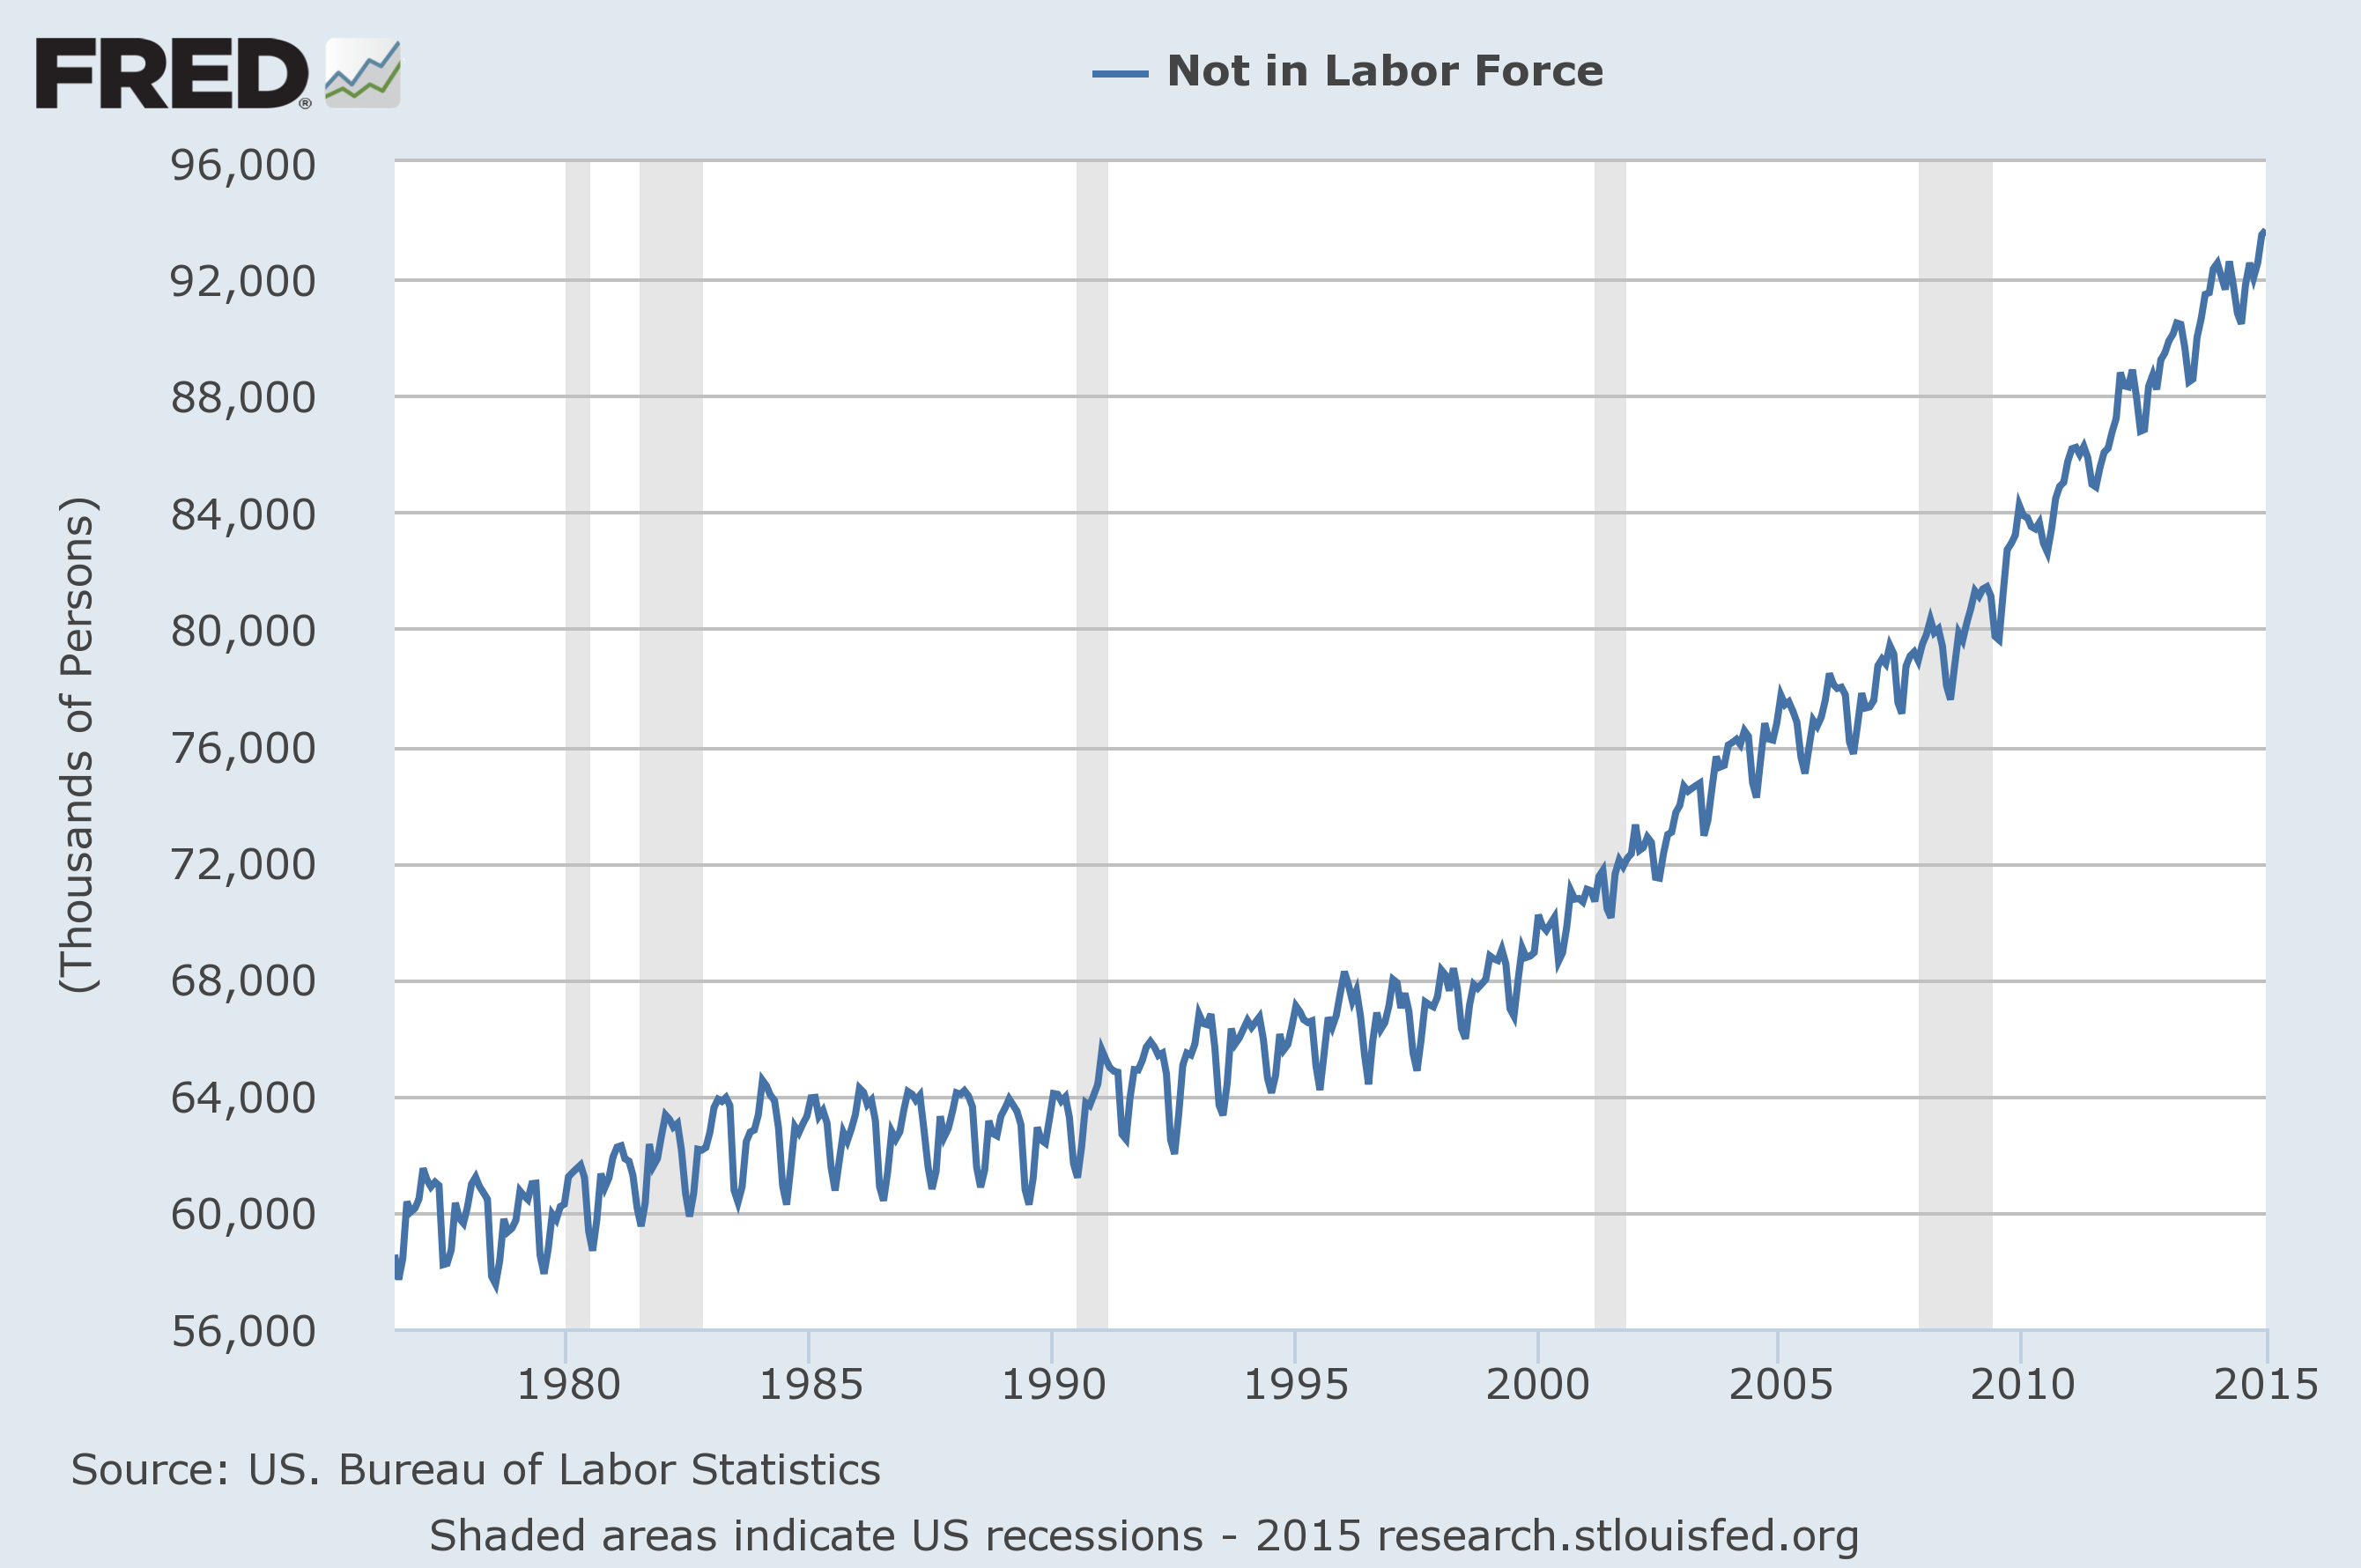
US. Bureau of Labor Statistics, Not in Labor Force [LNU05000000], retrieved from FRED, Federal Reserve Bank of St. Louis:
https://research.stlouisfed.org/fred2/series/LNU05000000/, February 6, 2015.
There are various aspects of the above “Not in Labor Force” measure that I continue to find worrisome, even when one takes into consideration various commonly cited factors regarding those retiring, those going back to school, etc. One aspects that I find worrisome is the “parabolic” trajectory. While this lengthy “parabolic trajectory” does not in itself “guarantee” any particular outcome, I view its formation and ascent to be disconcerting, especially since these types of “parabolic trajectories” often serve as an omen to future (substantially higher) values.
One question that arises is what fundamental factor(s) may cause the above-mentioned parabola to “explode” higher? While, unfortunately, there are many different reasons to expect a substantial increase in the “Not in Labor Force” statistic, the largest increase will accompany, as well as contribute to, the “Next Financial Crisis.”
_____
The Special Note summarizes my overall thoughts about our economic situation
SPX at 2055.47 as this post is written