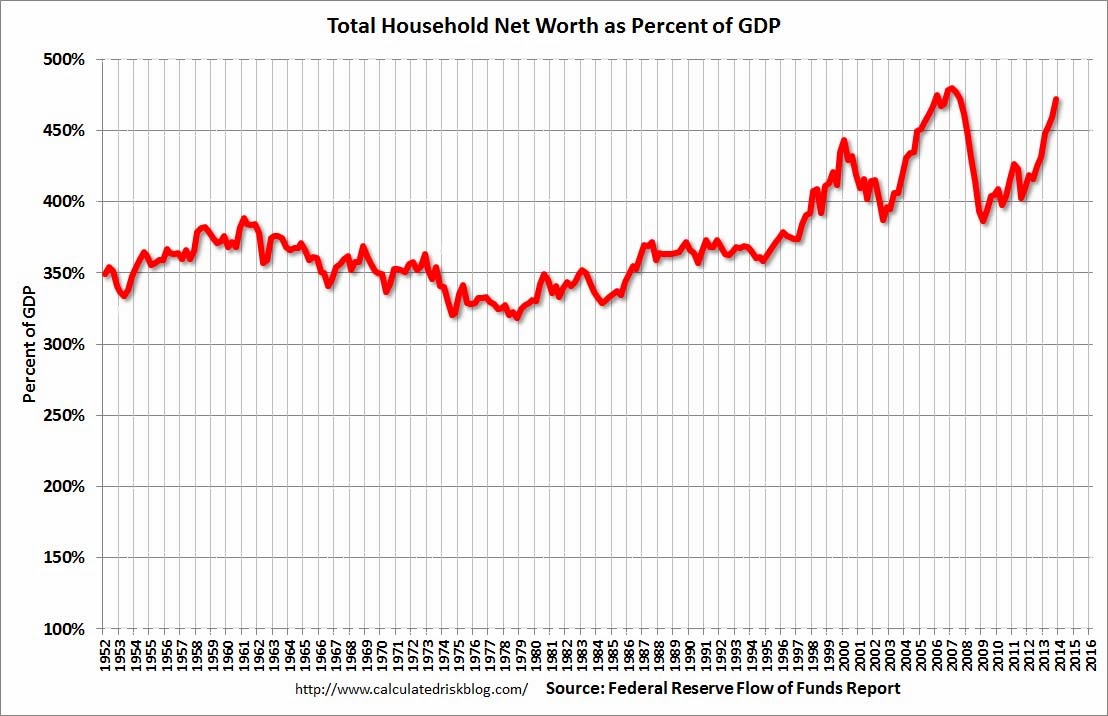
The following chart is from the CalculatedRisk blog post of March 6, 2014 titled “Fed’s Q4 Flow of Funds: Household Net Worth at Record High.” It depicts Total Household Net Worth as a Percent of GDP. The underlying data is from the Federal Reserve’s Z.1 report, “Financial Accounts of the United States“ :
(click on chart to enlarge image)
As seen in the above-referenced CalculatedRisk blog post:
According to the Fed, household net worth increased in Q4 compared to Q3, and is at a new record high. Net worth peaked at $68.8 trillion in Q2 2007, and then net worth fell to $55.6 trillion in Q1 2009 (a loss of $13.2 trillion). Household net worth was at $80.7 trillion in Q4 2013 (up $25.1 trillion from the trough in Q1 2009).
The Fed estimated that the value of household real estate increased to $19.4 trillion in Q4 2013. The value of household real estate is still $3.2 trillion below the peak in early 2006.
My comments:
As I have written in previous posts on this Household Net Worth (as a percent of GDP) topic:
As one can see, the first outsized peak was in 2000, and attained after the stock market bull market / stock market bubbles and economic strength. The second outsized peak was in 2007, right near the peak of the housing bubble as well as near the stock market peak.
As seen on the chart, the Total Household Net Worth is making an upturn, but is significantly below the prior 2007 peak.
I could extensively write about various interpretations that can be made from this chart. One way this chart can be interpreted is a gauge of “what’s in it for me?” as far as the aggregated wealth citizens are gleaning from economic activity, as measured compared to GDP.
_____
The Special Note summarizes my overall thoughts about our economic situation
SPX at 1877.94 as this post is written