I have written extensively on the issue of Quantitative Easing (QE) and Interventions as I believe many aspects of these practices lack recognition and understanding. Quantitative Easing in general carries an array of risks, detrimental impacts, unintended consequences, and complex impacts on the economy and markets.
One such set of dynamics embedded within QE that I believe lacks recognition is the risk of losses that can occur in the Federal Reserve’s portfolio. I previously wrote of this in the post of March 7, 2012 titled “Dynamics And Risks Of The Federal Reserve’s Portfolio.”
While the subject of potential losses is complex – and quantification of such potential losses is made difficult due to the many factors involved – the sheer size of the numbers involved, as well as various adverse situations that may develop during the course of portfolio losses – make this an issue that deserves recognition.
It should be noted that various parties believe that numerous mitigating factors minimize the importance of the potential for losses from the Fed’s portfolio. For instance, it appears that many people discount the risk of losses, as well as the potential for the Federal Reserve to exhaust its capital base, as they figure that the U.S. Treasury can always replenish the capital. As well, there is the issue of “mark to market” losses vs. accounting losses, and how the markets view the difference. (Note: as seen in the FRBSF Economic Letter of April 11, 2011: “…the Fed values its securities at acquisition cost and registers capital gains and losses only when securities are sold. Such historical-cost accounting is considered appropriate for a central bank that is motivated by macroeconomic policy objectives rather than financial profit and is consistent with the buy-and-hold securities strategy the Fed has traditionally followed.”) Other mitigating factors are cited as well, including reasoning cited by the Federal Reserve in the above-mentioned March 7, 2012 blog post.
However, if one believes that there is possible adverse impact(s) stemming from mark-to-market losses in the Federal Reserve’s portfolio as well as the exhaustion of the Federal Reserve’s capital, a disconcerting picture appears, especially in today’s rising interest rate environment.
Subsequent to my March 7, 2012 blog post, there have been some published analyses that attempt to quantify the potential for losses in the Federal Reserve’s portfolio. Two of these include the January 2013 Federal Reserve paper titled “The Federal Reserve’s Balance Sheet and Earnings: A primer and projections,” (discussed in the Wall Street Journal article of January 30, 2013 titled “Fed Risks Losses From Bonds“) as well as the Bloomberg article of February 26, 2013 titled “Fed Faces Explaining Billion-Dollar Losses in QE Exit Stress.”
While this Bloomberg article contains various interesting commentary, the following excerpts are especially notable:
MSCI’s data showed the greatest losses under the adverse scenario, as 10-year Treasury yields jump to 5.4 percent by the end of 2015 and three-month rates rise to 4 percent. The 10-year yield was 1.86 percent yesterday, and the three-month rate was 0.117 percent.
also:
Losses on the Fed’s portfolio rise steadily under the adverse scenario to $547 billion by the fourth quarter of 2015 in the MSCI analysis, which is purely a measure of interest-rate risk in the portfolio starting from bond prices at year end. It does not take account of purchases or sales the Fed may conduct in the future. The calculations are mark-to-market losses on the portfolio that take account of yield, amortization, accretion, and funding costs.
Also of critical importance is how sensitive the Federal Reserve’s asset portfolio is to an increase in interest rates before the capital base is exhausted. Cumberland Advisors publishes a CUMB-E Index (pdf) described as a measure of “Percentage point parallel shift in yield curve needed to exhaust Federal Reserve capital account.” This CUMB-E Index value as of June 19 stood at .27. (also of note is Cumberland’s “Total Assets Of Major Central Banks” (pdf) which shows the size, trends, and composition of major Central Bank assets.)
In aggregate, my interpretation of this potential for losses in the Federal Reserve’s portfolio is that the portfolio is highly susceptible (on an “all things considered” basis) to large (mark-to-market) losses. While the amount of these losses depends upon many factors, the overall dynamics of interest rates and their potential for quick and substantial increases serves to further magnify the potential for large losses.
In addition to the direct (mark-to-market) losses, there are also an array of direct and indirect adverse impact(s) these losses can have on the Federal Reserve, U.S. financial standing, and financial markets. While the extent of these various adverse impacts depends upon many factors, these impacts can cause many highly complex financial and policy problems.
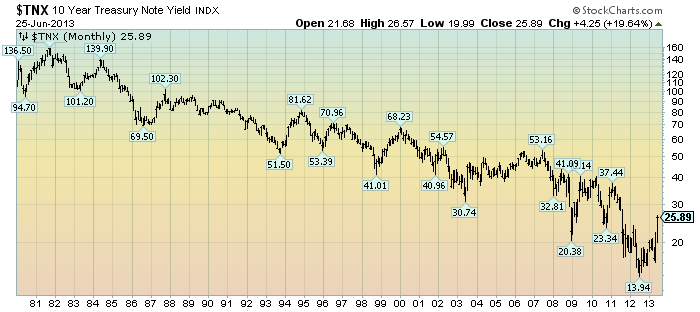
For reference, here is a chart of the 10-Year Treasury Note Yield since 1980, depicted on a monthly LOG basis since 1980 through June 25, 2013, with price labels:
(click on chart to enlarge image)(chart courtesy of StockCharts.com; chart creation and annotation by the author)
_____
The Special Note summarizes my overall thoughts about our economic situation
SPX at 1588.03 as this post is written