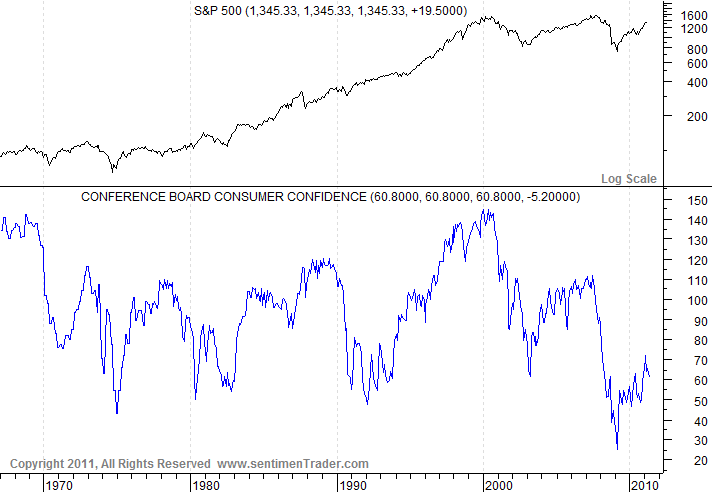
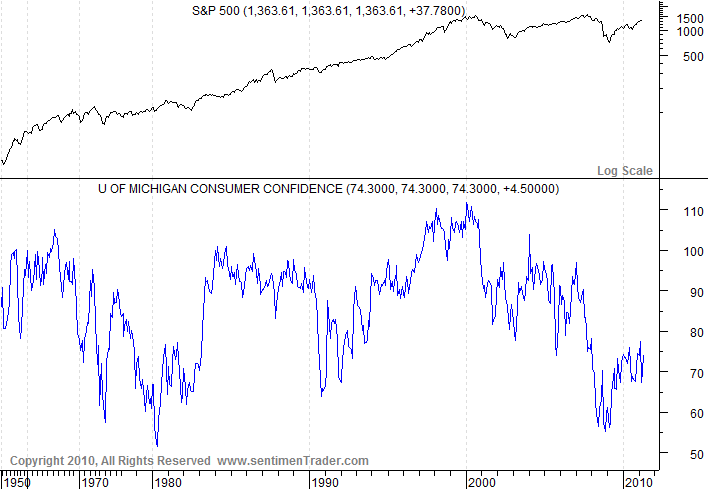
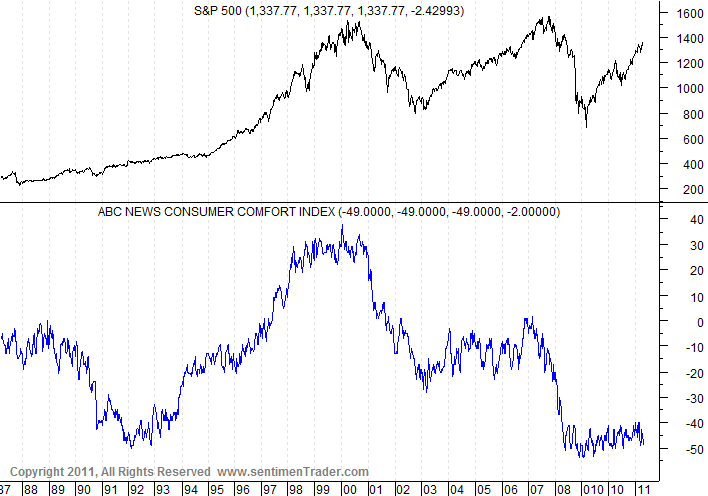
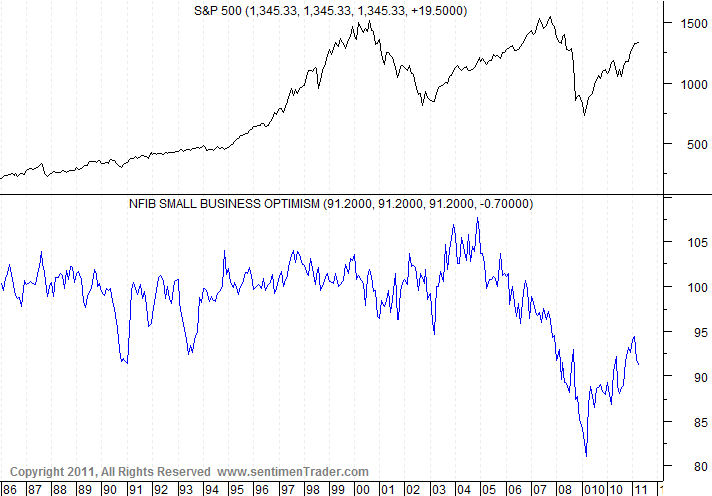
Here are four charts reflecting confidence survey readings. These are from the SentimenTrader.com site.
I find these charts valuable as they provide a long-term history of each survey, which is rare.
Each survey chart is plotted in blue, below the S&P500:
(click on each chart to enlarge image)
Conference Board Consumer Confidence, last updated 5-30-11:
–
University of Michigan Consumer Confidence, last updated 5-27-11:
–
Bloomberg Consumer Comfort Index (formerly the ABC News Consumer Comfort Index) last updated 5-20-11:
–
NFIB Small Business Optimism, last updated 5-31-11:
–
As one can see, these charts continue to show subdued readings, especially when viewed from a long-term perspective.
These charts should be interesting to monitor going forward. Although I don’t believe that confidence surveys should be overemphasized, they do help to delineate how the economic environment is being perceived.
_____
The Special Note summarizes my overall thoughts about our economic situation
SPX at 1314.55 as this post is written


