In yesterday’s post I displayed various charts of the U.S. Dollar from a long-term perspective.
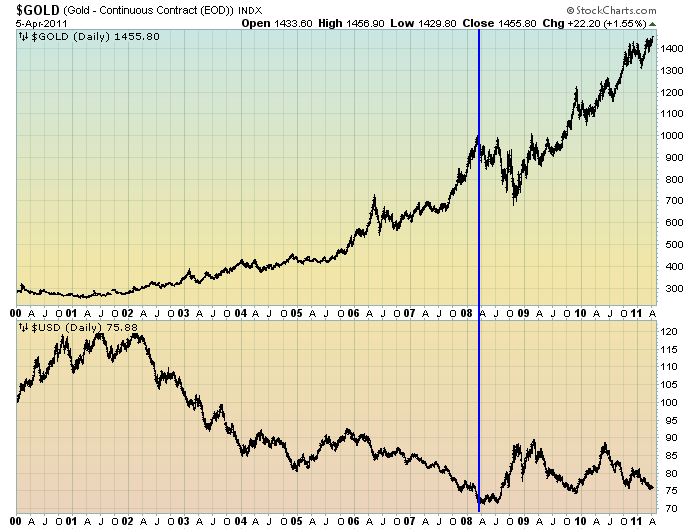
Below is a chart that I find interesting. It shows, from the year 2000 to present, the prices of Gold and the U.S. Dollar on a daily basis, linear-scale:
(chart courtesy of StockCharts.com; annotation by the author)
(click on chart image to enlarge)
–
As one can see, as annotated by the horizontal blue line, since the U.S. Dollar closed at a low of 71.45 on March 26, 2008, Gold has gone from roughly the $1000 area to yesterday’s close of $1455.80/oz. Meanwhile, the U.S. Dollar has yet to fall below that March 26, 2008 low.
This can be interpreted in a number of ways. One interpretation that I favor is seen stated below, from a piece I wrote on February 3:
Further supporting the idea that the U.S. dollar is vulnerable is the very strong price action of gold, other commodities, other currencies, and the stock market. While it may be easy to believe gold and other commodities are in a bubble, such strong price action (which has far outpaced the U.S. dollar’s decline to date) may well be indicating a large impending dollar decline.
_____
The Special Note summarizes my overall thoughts about our economic situation
SPX at 1332.63 as this post is written
