This post, and the next, will deal with economic activity and economic indicators.
My most recent update of various economic indicators was on March 15.
One indicator that I have yet to add to this list is that of the Chicago Fed National Activity Index. Many people believe the Chicago Fed National Activity Index to be the best, or among the best, indicator of economic activity. Among its strengths is its broad nature, as it is comprised of 85 individual indicators.
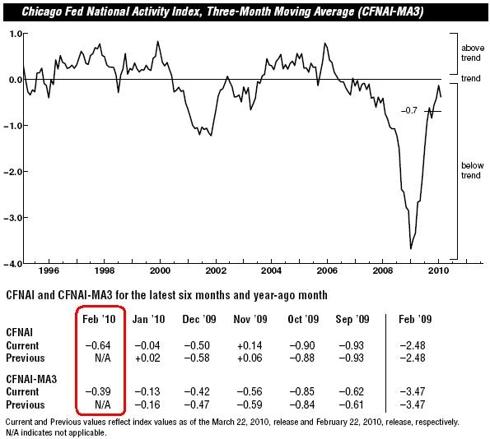
Here is the most recent (March 22) chart of the CFNAI, that depicts February activity:
Source: Chicago Federal Reserve (pdf)
It is important to note that the trend shown on the chart is a 3-month moving average. One can see the monthly values denoted in the table as “CFNAI.”
Overall, one can see the chart depicts the 3-month average as still being “below trend” after making a strong rebound off the early-2009 lows.
What I find interesting in this data is that it seems to indicate that the rate of economic rebound appears to have peaked. This same indication is seen in many of the economic indicators shown in the March 15 post.
If it true that we are now off-peak in terms of the rate of economic growth, the pivotal question becomes what will be the going-forward growth rate. As shown in the various economist forecasts that I have posted, most economists (as well as other professionals) are assuming a growth rate consistent with full-year GDP of 3%…i.e. relatively steady growth for the rest of the year.
However, there are also some who think a “double-dip” or other resumption of weakness is likely.
Is it possible that the rate of economic activity is already on a faster than anticipated decline? It appears too early to definitively say, based upon this CFNAI and other indicators. However, this possibility is something that I certainly think bears close monitoring as the implications of such could (dependent upon the extent of such weakness) be enormous.
back to <home>
SPX at 1173.22 as this post is written
