In August, I wrote an article titled “America’s Trojan Horse” which can be found listed along the right-side of the homepage as well as at this link:
https://www.economicgreenfield.com/americas-trojan-horse/
This article had to do with various facets of our national debt, many unexplored. Here is an excerpt that I would like to further comment upon:
“The first of these concepts is that the financial markets have allowed us to grow and perpetuate our debt loads, absorbing this debt issuance at reasonable, if not low, interest rates. While this continual absorption of ever-increasing debt at lower rates is counterintuitive, it has nonetheless occurred. Why this counterintuitive event has occurred is largely unknown. Although it appears to be a long-term market anomaly (a propitious one at that) it might also be a concatenation of short-term market anomalies. The latter supposition is certainly a troubling facet to ponder, as it would likely make our ability to sustain such debt levels more tenuous.”
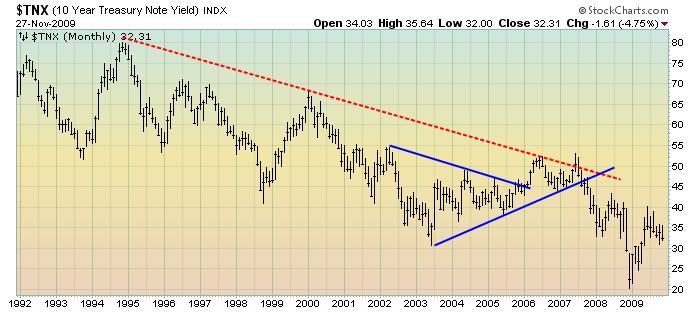
Here is a long-term monthly chart of the 10-year Treasury yield. As one can see, the trend in yields has been down:
Chart courtesy of Stockcharts.com
Various economists have recently stated the national debt is at roughly $6 Trillion, or roughly 40% of GDP. They view the “danger point” as the national debt to GDP ratio of 100%, meaning that we can incur an additional $8 Trillion in national debt (to roughly $14 Trillion) before reaching the 100% level. Given that $8 Trillion in additional national indebtedness would likely take a few years to incur, it would appear based off of this reasoning that we have some time before the 100% “danger point” is reached. I don’t agree with these figures (IMHO the actual level of debt is far higher) as well as the line of reasoning. No one really knows at what time or level the national debt hits a critical level.
It currently appears that the amount of the national debt is “tolerable” and is not causing undue concern in the markets. Metrics that cause me to draw this conclusion include the subdued level of interest rates on government debt (as seen by the above chart), seemingly low price levels of the sovereign credit default swaps of the United States, and a general lack of concern shown by the public and Congress, despite ever-increasing deficits that appear to be heading for at least $1 Trillion annually for the foreseeable future. It wasn’t too long ago that a $500 Billion annual deficit was considered exceedingly high.
However, is this national debt level really as “acceptable” as it appears? Do we have a number of years at current deficit levels before we hit the “danger point?” When we do approach the “danger point,” how long will we have before there are repercussions, and how serious will these repercussions be?
These questions are difficult to answer, as they appear contingent upon a number of complex, interrelated factors. I have some theories as to how and when the “danger point” will be reached, as well as the repercussions. However, these theories are still in the “formative” stages and thus I do not wish to explicitly specify a number or timeframe.
However, I will say that I am led to believe that the level of national debt, as well as our present propensity to accrue it, is not as “tolerable” as it may appear. In other words, I believe the “danger point” and subsequent repercussions may be reached sooner than the consensus believes.
If this “danger point” does present itself relatively quickly, of course it would have ramifications in many areas. Stimulus-based deficit spending, as well as other deficit spending, could likely become prohibitive. As well, other tangential effects could include higher interest rates. Furthermore, there may be a sudden need to actually reduce significant portions of the national debt.
back to <home>
SPX at 1087.27 as this post is written
