In the June 16 post (“The S&P500 Since 2007”) I displayed an annotated chart of the S&P500.
In that post I stated the following:
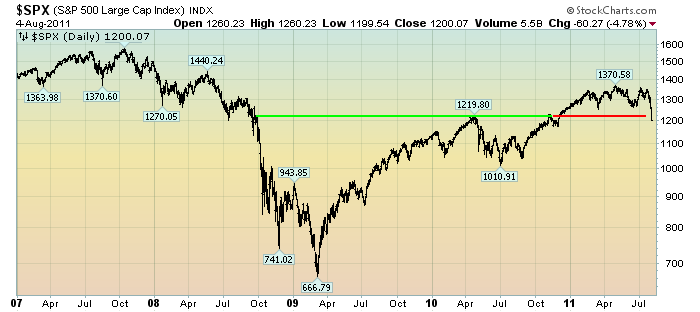
As one can see from the chart, one interpretation that can be made is that of a (completed) “Cup & Handle” chart formation as denoted by the green line. I have added a red line to now denote the 1220 area. I think it would be significant if the S&P500 falls below this 1220 level now, as the 1220 level is technically significant in many different ways.
Here is that same chart updated through yesterday:
(chart courtesy of StockCharts.com; annotations by the author)
click on chart to enlarge
–
During yesterday’s decline, the S&P500 failed to find support at this 1220 level, as seen on the chart. This is very significant, and I don’t believe that it bodes well for the stock market in the short-term.
My beliefs about the stock market’s future direction are complex; I will elaborate in future posts…
_____
The Special Note summarizes my overall thoughts about our economic situation
SPX at 1200.07 as this post is written
