The existence of asset bubbles continues to be among the most critical – and troubling – characteristics of the current-era U.S. economy. I have written extensively on the subject for a number of reasons, including its monumental importance as well as its poorly understood nature.
There are many theories as to why asset bubbles form. My own thoughts on the matter are highly complex, especially concerning the current-era bubbles.
One common theory as to why asset bubbles form is the existence of (ultra-) low interest rates. I have discussed this facet previously, including in the December 2, 2009 post titled “Bubbles.”
One prominent way to measure as to whether interest rates are “abnormally low” is by comparing rates – typically the “Fed Funds” rate – to the rate implied by the “Taylor Rule.” A simple description of that rule can be seen in the December 20, 2016 Wall Street Journal op-ed (“The Case for a Rules-Based Fed“) written by John B. Taylor, creator of the Taylor Rule. An excerpt:
Mr. Kashkari’s argument against rules-based strategies focuses on the “Taylor rule,” which emerged from my research in the 1970s and ’80s and has been used in virtually every country in the world. The rule calls for central banks to increase interest rates by a certain amount when price inflation rises and to decrease interest rates by a certain amount when the economy goes into a recession.
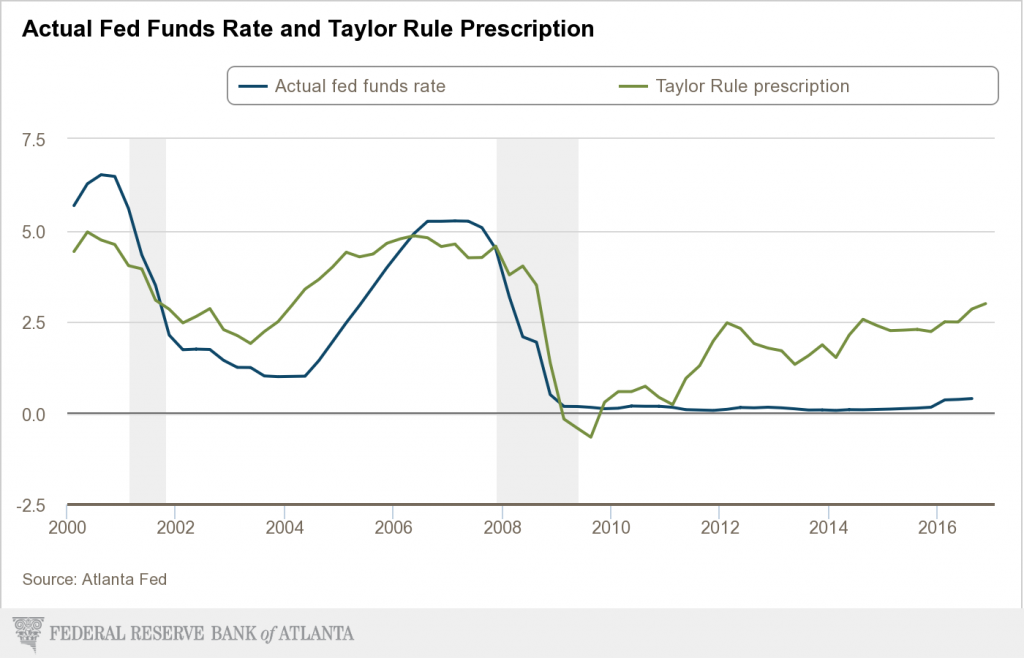
While my thoughts on the “Taylor Rule” are complex and aren’t suitably discussed in a brief manner, I will say that I don’t necessarily agree with its theoretical framework and/or the methodologies employed, or implications. However, I do think that its current readings are both notable and informative. Among notable aspects, one can clearly see that the Fed Funds rate has been far below the “Taylor Rule” prescription for a protracted time period.
The Federal Reserve Bank of Atlanta provides detailed information concerning the “Taylor Rule,” which includes the chart shown below. One should note that the readings are influenced by a number of assumptions, and thus it is both possible and likely that the readings of the model can change significantly with changes in the assumptions.
The chart below is updated through December 22, 2016:
_____
The Special Note summarizes my overall thoughts about our economic situation
SPX at 2270.16 as this post is written