Here is an update of various indicators that are supposed to predict and/or depict economic activity. These indicators have been discussed in previous blog posts:
The June 2015 Chicago Fed National Activity Index (CFNAI) updated as of June 22, 2015:
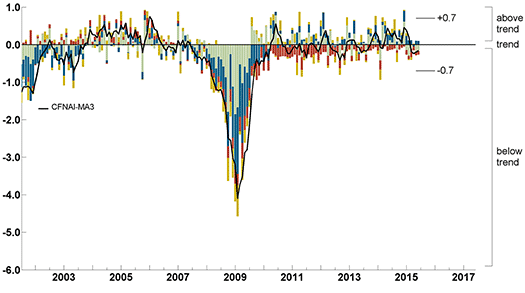
–
The ECRI WLI (Weekly Leading Index):
As of June 19, 2015 (incorporating data through June 12, 2015) the WLI was at 134.3 and the WLI, Gr. was at 1.0%.
A chart of the WLI,Gr., from Doug Short’s post of June 19, 2015, titled “ECRI: ‘Shifting Patterns in Recessions and Recoveries’“:
–
The Aruoba-Diebold-Scotti Business Conditions (ADS) Index:
Here is the latest chart, depicting the ADS Index from December 31, 2007 through June 13, 2015:
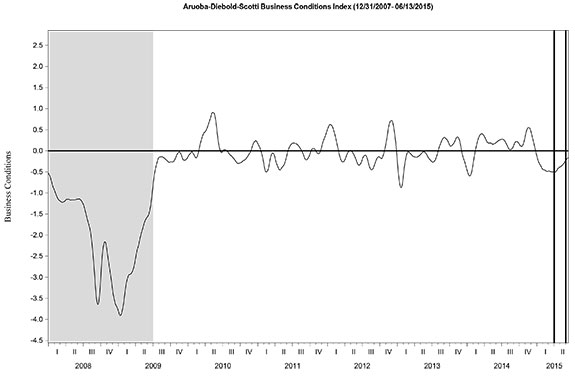
–
The Conference Board Leading (LEI) and Coincident (CEI) Economic Indexes:
As per the June 18, 2015 press release, titled “The Conference Board Leading Economic Index (LEI) for the U.S. Increased Again,” the LEI was at 123.1 and the CEI was at 112.1 in May.
An excerpt from the June 18 release:
“The U.S. LEI increased sharply again in May, confirming the outlook for more economic expansion in the second half of the year after what looks to be a much weaker first half,” said Ataman Ozyildirim, Director, Business Cycles and Growth Research, at The Conference Board. “While residential construction and consumer expectations support the more positive outlook, industrial production and new orders in manufacturing are painting a somewhat more mixed picture.”
Here is a chart of the LEI from Doug Short’s blog post of June 18 titled “Conference Board Leading Economic Index Increased Again in May“:
_________
I post various indicators and indices because I believe they should be carefully monitored. However, as those familiar with this blog are aware, I do not necessarily agree with what they depict or imply.
_____
The Special Note summarizes my overall thoughts about our economic situation
SPX at 2128.69 as this post is written