Here is an update of various indicators that are supposed to predict and/or depict economic activity. These indicators have been discussed in previous blog posts:
The July 2014 Chicago Fed National Activity Index (CFNAI)(pdf) updated as of July 21, 2014:
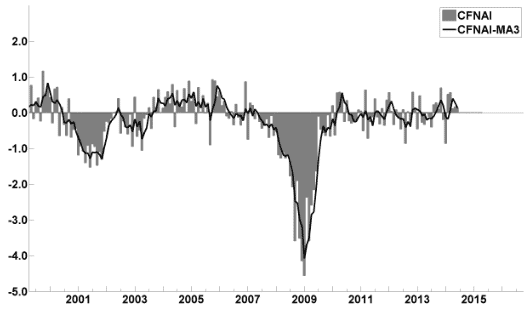
–
The ECRI WLI (Weekly Leading Index):
As of July 18, 2014 (incorporating data through July 11, 2014) the WLI was at 135.2 and the WLI, Gr. was at 4.2%.
Here is a chart of the ECRI WLI,Gr., from Doug Short’s July 18, 2014 post titled “ECRI Recession Watch: Weekly Update” :
–
The Aruoba-Diebold-Scotti Business Conditions (ADS) Index:
Here is the latest chart, depicting the ADS Index from July 12, 2012 through June 12, 2014:
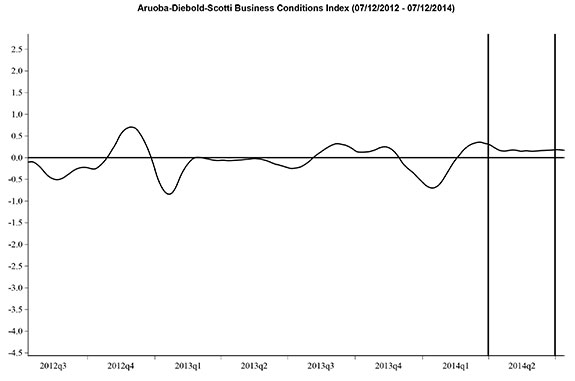
–
The Conference Board Leading (LEI) and Coincident (CEI) Economic Indexes:
As per the July 18, 2014 press release, the LEI was at 102.2 and the CEI was at 109.2 in June.
An excerpt from the July 18 release:
“The CEI shows the pace of economic activity continued to expand moderately through June,” said Ken Goldstein, Economist at The Conference Board. “Stronger consumer demand driven by sustained job gains and improving confidence remains the main source of improvement for the U.S. economy. In addition to a stronger housing market, more business investment could also provide an upside to the overall economy.”
Here is a chart of the LEI from Doug Short’s blog post of July 18 titled “Conference Board Leading Economic Index: Fifth Monthly Increase“ :
_________
I post various indicators and indices because I believe they should be carefully monitored. However, as those familiar with this blog are aware, I do not necessarily agree with what they depict or imply.
_____
The Special Note summarizes my overall thoughts about our economic situation
SPX at 1974.20 as this post is written