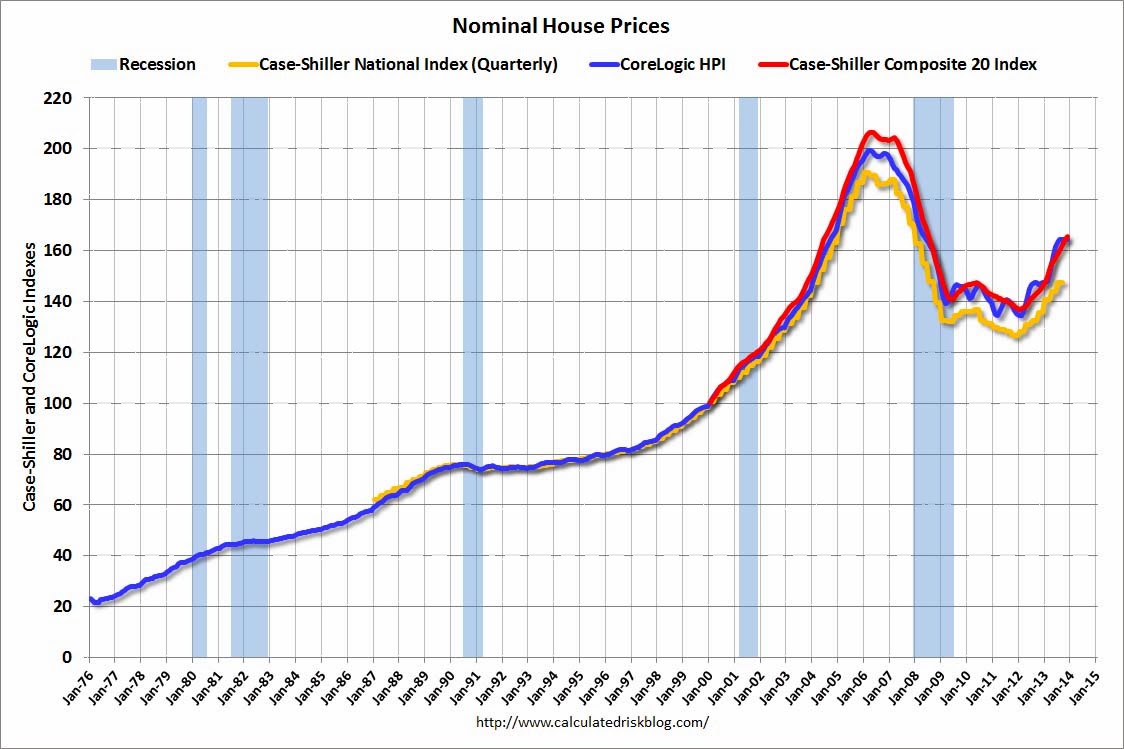
As a reference for long-term house price index trends, below is a chart, updated with the most current data (through November, except for the Case-Shiller National Index, which is through September), from the CalculatedRisk blog post of January 28 titled “Comment on House Prices: Real Prices, Price-to-Rent Ratio, Cities” :
(click on chart to enlarge image)
_____
The Special Note summarizes my overall thoughts about our economic situation
SPX at 1792.50 as this post is written