Here is an update on various indicators that are supposed to predict and/or depict economic activity. These indicators have been discussed in previous blog posts:
The July 2013 Chicago Fed National Activity Index (CFNAI)(pdf) updated as of July 22, 2013:
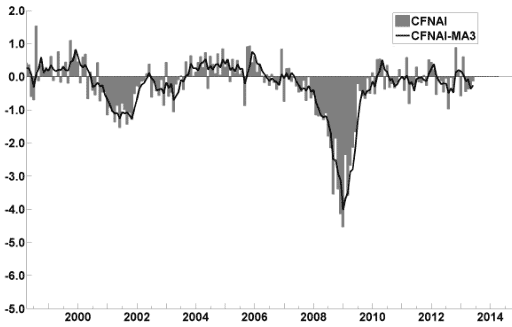
–
The ECRI WLI (Weekly Leading Index):
As of 7/19/13 (incorporating data through 7/12/13) the WLI was at 131.2 and the WLI, Gr. was at 4.5%.
A chart of the WLI, Gr. since 2000, from Doug Short’s blog of July 19 titled “ECRI Recession Watch: Weekly Update” :
–
The Aruoba-Diebold-Scotti Business Conditions (ADS) Index:
Here is the latest chart, depicting 12-31-07 through 7-13-13:
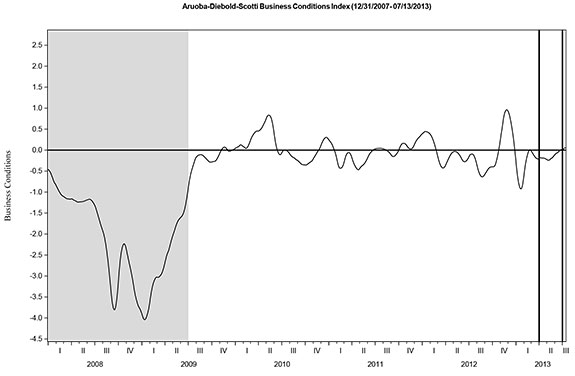
–
The Conference Board Leading (LEI) and Coincident (CEI) Economic Indexes:
As per the July 18 press release, the LEI was at 95.3 and the CEI was at 105.9 in June.
An excerpt from the July 18 release:
Says Ataman Ozyildirim, economist at The Conference Board: “The U.S. LEI was flat in June. Declines in building permits, new orders and stock prices were offset by gains in consumer expectations, initial claims for unemployment insurance, and other financial indicators. However, the LEI’s six-month growth rate remains positive, suggesting the economy will continue expanding through the end of the year.”
Here is a chart of the LEI from Doug Short’s blog post of July 18 titled “Conference Board Leading Economic Index: Unchanged In June” :
_________
I post various indicators and indices because I believe they should be carefully monitored. However, as those familiar with this blog are aware, I do not necessarily agree with what they depict or imply.
_____
The Special Note summarizes my overall thoughts about our economic situation
SPX at 1691.52 as this post is written